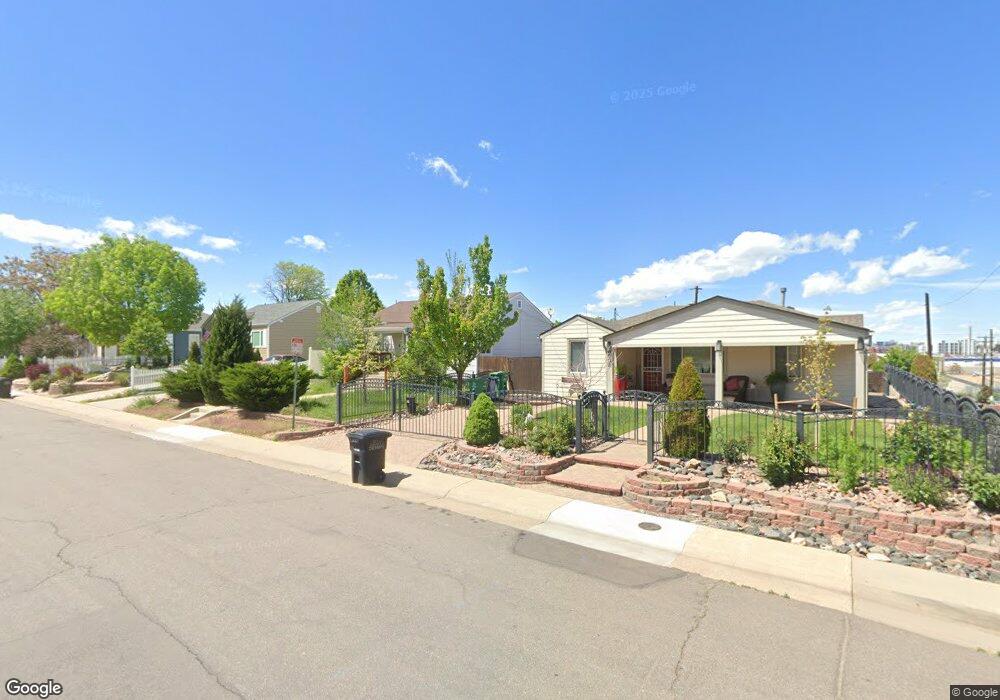
2705 W Park Place Denver, CO 80219
Valverde NeighborhoodEstimated Value: $423,918 - $510,000
4
Beds
2
Baths
1,539
Sq Ft
$294/Sq Ft
Est. Value
About This Home
This home is located at 2705 W Park Place, Denver, CO 80219 and is currently estimated at $452,980, approximately $294 per square foot. 2705 W Park Place is a home located in Denver County with nearby schools including Barnum Elementary School, Kepner Beacon Middle School, and West High School.
Ownership History
Date
Name
Owned For
Owner Type
Purchase Details
Closed on
Oct 26, 2011
Sold by
1 In A Million Llc
Bought by
Putzel Michael
Current Estimated Value
Home Financials for this Owner
Home Financials are based on the most recent Mortgage that was taken out on this home.
Original Mortgage
$136,158
Outstanding Balance
$92,712
Interest Rate
3.99%
Mortgage Type
FHA
Estimated Equity
$360,268
Purchase Details
Closed on
Mar 11, 2011
Sold by
Vigil Daniel L
Bought by
1 In A Million Llc
Home Financials for this Owner
Home Financials are based on the most recent Mortgage that was taken out on this home.
Original Mortgage
$91,000
Interest Rate
4.78%
Mortgage Type
Purchase Money Mortgage
Purchase Details
Closed on
Nov 12, 2003
Sold by
Vigil Daniel L and Vigil Rita
Bought by
Vigil Daniel L
Home Financials for this Owner
Home Financials are based on the most recent Mortgage that was taken out on this home.
Original Mortgage
$122,500
Interest Rate
4.87%
Mortgage Type
Purchase Money Mortgage
Create a Home Valuation Report for This Property
The Home Valuation Report is an in-depth analysis detailing your home's value as well as a comparison with similar homes in the area
Home Values in the Area
Average Home Value in this Area
Purchase History
| Date | Buyer | Sale Price | Title Company |
|---|---|---|---|
| Putzel Michael | $139,700 | Fidelity National Title Insu | |
| 1 In A Million Llc | $56,500 | Fidelity National Title Insu | |
| Vigil Daniel L | -- | -- |
Source: Public Records
Mortgage History
| Date | Status | Borrower | Loan Amount |
|---|---|---|---|
| Open | Putzel Michael | $136,158 | |
| Previous Owner | 1 In A Million Llc | $91,000 | |
| Previous Owner | Vigil Daniel L | $122,500 | |
| Closed | Vigil Daniel L | $16,500 |
Source: Public Records
Tax History Compared to Growth
Tax History
| Year | Tax Paid | Tax Assessment Tax Assessment Total Assessment is a certain percentage of the fair market value that is determined by local assessors to be the total taxable value of land and additions on the property. | Land | Improvement |
|---|---|---|---|---|
| 2024 | $2,272 | $28,680 | $4,940 | $23,740 |
| 2023 | $2,222 | $28,680 | $4,940 | $23,740 |
| 2022 | $1,978 | $24,870 | $8,950 | $15,920 |
| 2021 | $1,978 | $25,580 | $9,210 | $16,370 |
| 2020 | $1,528 | $20,600 | $5,990 | $14,610 |
| 2019 | $1,486 | $20,600 | $5,990 | $14,610 |
| 2018 | $1,327 | $17,150 | $6,030 | $11,120 |
| 2017 | $1,323 | $17,150 | $6,030 | $11,120 |
| 2016 | $870 | $10,670 | $4,872 | $5,798 |
| 2015 | $834 | $10,670 | $4,872 | $5,798 |
| 2014 | $767 | $9,230 | $2,054 | $7,176 |
Source: Public Records
Map
Nearby Homes
- 2726 W 1st Ave
- 2658 W 1st Ave
- 2772 W Ellsworth Ave
- 2915 W 4th Ave
- 2732 W Archer Place
- 2823 W Archer Place
- 118 S Dale Ct
- 45 S Grove St
- 175 S Eliot St
- 3130 W Bayaud Ave
- 3300 W 2nd Ave
- 222 S Canosa Ct
- 107 Irving St
- 10 S Irving St
- 112 S Hooker St
- 160 Julian St
- 44 Julian St
- 354 Julian St
- 212 Knox Ct
- 326 S Alcott St
- 2717 W Park Place
- 2701 W Park Place
- 2731 W Park Place
- 2722 W 2nd Ave
- 2735 W Park Place
- 2710 W Park Place
- 2700 W Park Place
- 2728 W 2nd Ave
- 2720 W Park Place
- 162 Clay St
- 2704 W 2nd Ave
- 156 Clay St
- 170 Clay St
- 2726 W Park Place
- 150 Clay St
- 2751 W Park Place
- 180 Clay St
- 2730 W 2nd Ave
- 2732 W Park Place
- 140 Clay St