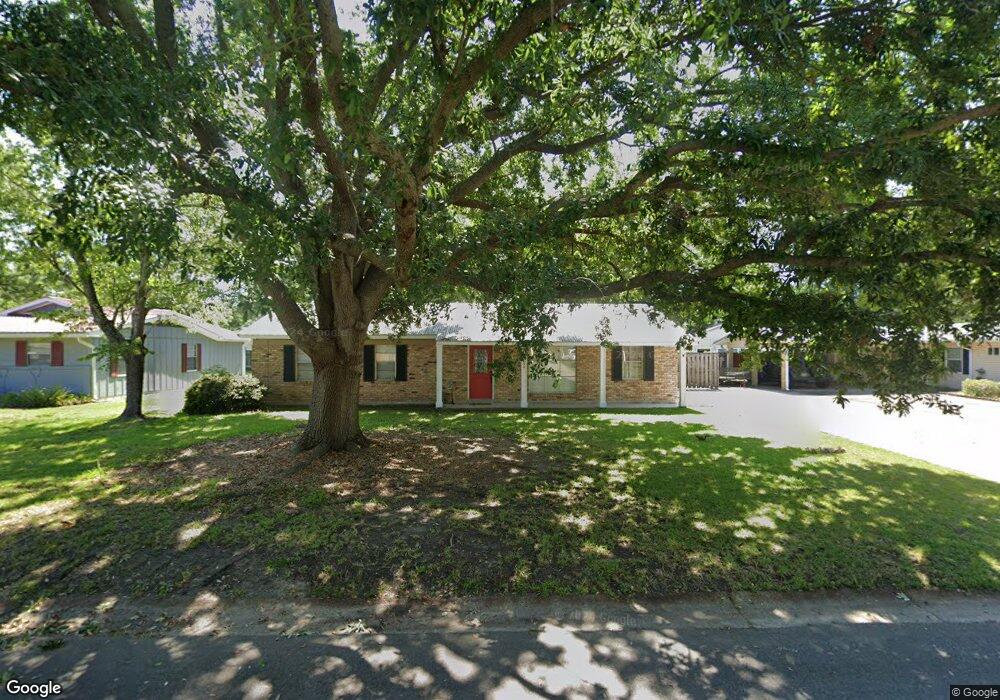
2706 Lynwood St Pascagoula, MS 39567
Estimated Value: $140,800 - $168,000
--
Bed
2
Baths
1,484
Sq Ft
$104/Sq Ft
Est. Value
About This Home
This home is located at 2706 Lynwood St, Pascagoula, MS 39567 and is currently estimated at $154,450, approximately $104 per square foot. 2706 Lynwood St is a home located in Jackson County with nearby schools including Eastlawn Elementary School, Trent Lott Academy, and Colmer Middle School.
Ownership History
Date
Name
Owned For
Owner Type
Purchase Details
Closed on
Sep 18, 2020
Sold by
Andrews Timothy S
Bought by
Busby Jessica
Current Estimated Value
Home Financials for this Owner
Home Financials are based on the most recent Mortgage that was taken out on this home.
Original Mortgage
$126,683
Outstanding Balance
$112,423
Interest Rate
2.9%
Mortgage Type
FHA
Estimated Equity
$42,027
Purchase Details
Closed on
Nov 2, 2012
Sold by
Mcree Ryan Thomas
Bought by
Andrews Timothy S
Create a Home Valuation Report for This Property
The Home Valuation Report is an in-depth analysis detailing your home's value as well as a comparison with similar homes in the area
Home Values in the Area
Average Home Value in this Area
Purchase History
| Date | Buyer | Sale Price | Title Company |
|---|---|---|---|
| Busby Jessica | -- | None Available | |
| Andrews Timothy S | -- | Island Winds Title Company |
Source: Public Records
Mortgage History
| Date | Status | Borrower | Loan Amount |
|---|---|---|---|
| Open | Busby Jessica | $126,683 |
Source: Public Records
Tax History Compared to Growth
Tax History
| Year | Tax Paid | Tax Assessment Tax Assessment Total Assessment is a certain percentage of the fair market value that is determined by local assessors to be the total taxable value of land and additions on the property. | Land | Improvement |
|---|---|---|---|---|
| 2024 | $1,074 | $8,767 | $1,571 | $7,196 |
| 2023 | $1,074 | $8,767 | $1,571 | $7,196 |
| 2022 | $1,061 | $8,767 | $1,571 | $7,196 |
| 2021 | $1,067 | $8,802 | $1,571 | $7,231 |
| 2020 | $820 | $7,021 | $1,571 | $5,450 |
| 2019 | $829 | $7,021 | $1,571 | $5,450 |
| 2018 | $843 | $7,021 | $1,571 | $5,450 |
| 2017 | $696 | $7,021 | $1,571 | $5,450 |
| 2016 | $710 | $7,207 | $1,571 | $5,636 |
| 2015 | $838 | $81,710 | $15,710 | $66,000 |
| 2014 | $846 | $8,171 | $1,571 | $6,600 |
| 2013 | $1,122 | $8,171 | $1,571 | $6,600 |
Source: Public Records
Map
Nearby Homes
- 2710 Lynwood St
- 2702 Lynwood St
- 2707 Larchmont St
- 2711 Larchmont St
- 2612 Lynwood St
- 2711 Lynwood St
- 2703 Lynwood St
- 2615 Larchmont St
- 2715 Larchmont St
- 2717 Lynwood St
- 2615 Lynwood St
- 2718 Lynwood St
- 2608 Lynwood St
- 2721 Larchmont St
- 2609 Larchmont St
- 2721 Lynwood St
- 2609 Lynwood St
- 2706 Fernwood St
- 2706 Larchmont St
- 2702 Fernwood St