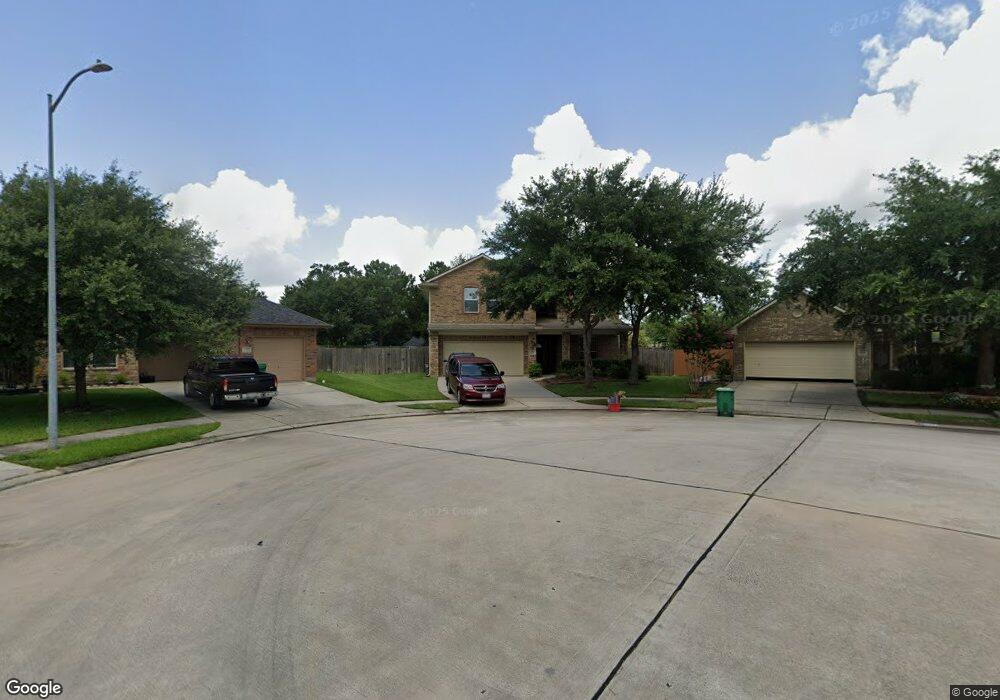
2707 Fountainbrook Park Ct Spring, TX 77386
Imperial Oaks NeighborhoodEstimated Value: $374,670 - $423,000
--
Bed
1
Bath
2,751
Sq Ft
$145/Sq Ft
Est. Value
About This Home
This home is located at 2707 Fountainbrook Park Ct, Spring, TX 77386 and is currently estimated at $398,418, approximately $144 per square foot. 2707 Fountainbrook Park Ct is a home located in Montgomery County with nearby schools including Kaufman Elementary School, Vogel Intermediate School, and Irons J High School.
Ownership History
Date
Name
Owned For
Owner Type
Purchase Details
Closed on
Jun 27, 2008
Sold by
Wl Texas Lp
Bought by
Lindholm Timothy Eric and Lindholm Brenda
Current Estimated Value
Home Financials for this Owner
Home Financials are based on the most recent Mortgage that was taken out on this home.
Original Mortgage
$200,724
Outstanding Balance
$129,362
Interest Rate
6.05%
Mortgage Type
VA
Estimated Equity
$269,056
Purchase Details
Closed on
Jun 13, 2007
Sold by
Sugarfield Partners Ii Ltd
Bought by
Lindholm Timothy Eric and Lindholm Brenda
Purchase Details
Closed on
Jul 18, 2006
Sold by
Imperial Oaks No 3 Ltd
Bought by
Lindholm Timothy Eric and Lindholm Brenda
Create a Home Valuation Report for This Property
The Home Valuation Report is an in-depth analysis detailing your home's value as well as a comparison with similar homes in the area
Home Values in the Area
Average Home Value in this Area
Purchase History
| Date | Buyer | Sale Price | Title Company |
|---|---|---|---|
| Lindholm Timothy Eric | -- | Stewart Title Of Montgomery | |
| Lindholm Timothy Eric | -- | -- | |
| Lindholm Timothy Eric | -- | -- |
Source: Public Records
Mortgage History
| Date | Status | Borrower | Loan Amount |
|---|---|---|---|
| Open | Lindholm Timothy Eric | $200,724 |
Source: Public Records
Tax History Compared to Growth
Tax History
| Year | Tax Paid | Tax Assessment Tax Assessment Total Assessment is a certain percentage of the fair market value that is determined by local assessors to be the total taxable value of land and additions on the property. | Land | Improvement |
|---|---|---|---|---|
| 2025 | $5,736 | $369,841 | $68,000 | $301,841 |
| 2024 | $5,893 | $345,576 | -- | -- |
| 2023 | $5,893 | $314,160 | $68,000 | $279,180 |
| 2022 | $8,385 | $328,150 | $31,190 | $296,960 |
| 2021 | $7,173 | $259,640 | $31,190 | $228,450 |
| 2020 | $7,372 | $255,590 | $31,190 | $224,400 |
| 2019 | $7,715 | $260,260 | $31,190 | $229,070 |
| 2018 | $7,269 | $245,210 | $31,190 | $214,020 |
| 2017 | $7,311 | $245,210 | $31,190 | $214,020 |
| 2016 | $7,112 | $238,530 | $31,190 | $207,340 |
| 2015 | $6,682 | $234,300 | $31,190 | $203,110 |
| 2014 | $6,682 | $218,950 | $31,190 | $187,760 |
Source: Public Records
Map
Nearby Homes
- 31419 Fountainbrook Park Ln
- 31602 Forest Oak Park Ct
- 2618 Bridgestone Park Ln
- 31214 Windcrest Park Ln
- 2526 Hidden Park Ln
- 31235 Windcrest Park Ln
- 31815 Forest Oak Ln
- 32315 Golden Oak Park Ln
- 32331 Summer Park Ln
- 31810 Forest Oak Ln
- 2898 Woodland Glen Ln
- 31563 Ember Trail Ln
- 31527 Reston Cliff Ct
- 3317 Starlight Hill Ct
- 32364 Mossy Pine Way
- 2707 Oak Pass Ct
- 3002 Rusty Bridge Ct
- 2614 Winding Creek Way
- 31525 Ember Trail Ln
- 3301 Asbury Glen Ct
- 2711 Fountainbrook Park Ct
- 2703 Fountainbrook Park Ct
- 2706 Fountainbrook Park Ct
- 2710 Fountainbrook Park Ct
- 31411 Fountainbrook Park Ln
- 31402 Fountainbrook Park Ln
- 31318 Fountainbrook Park Ln
- 31238 Quail Oak Park Ln
- 31406 Fountainbrook Park Ln
- 31234 Quail Oak Park Ln
- 31242 Quail Oak Park Ln
- 31230 Quail Oak Park Ln
- 31415 Fountainbrook Park Ln
- 31246 Quail Oak Park Ln
- 31319 Fountainbrook Park Ln
- 31314 Fountainbrook Park Ln
- 31410 Fountainbrook Park Ln
- 31226 Quail Oak Park Ln
- 31250 Quail Oak Park Ln
- 31414 Fountainbrook Park Ln