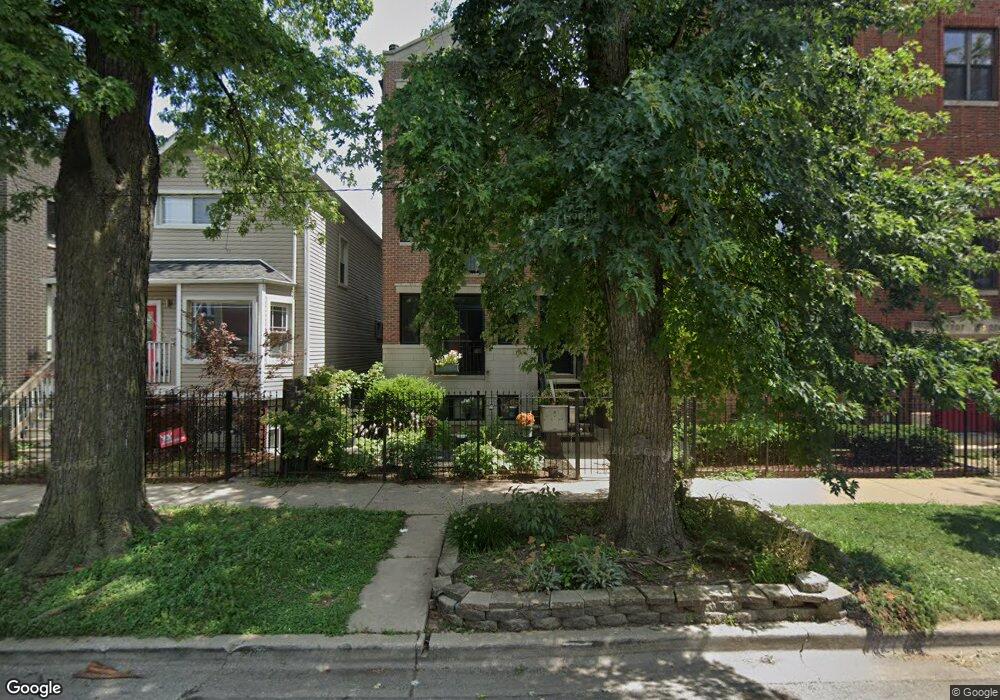
2707 N Campbell Ave Unit 1N Chicago, IL 60647
Logan Square NeighborhoodEstimated Value: $356,415 - $479,000
2
Beds
2
Baths
9,012
Sq Ft
$46/Sq Ft
Est. Value
About This Home
This home is located at 2707 N Campbell Ave Unit 1N, Chicago, IL 60647 and is currently estimated at $416,854, approximately $46 per square foot. 2707 N Campbell Ave Unit 1N is a home located in Cook County with nearby schools including Brentano Math & Science Academy, Schurz High School, and Acero Charter - Carlos Fuentes Cmpus.
Ownership History
Date
Name
Owned For
Owner Type
Purchase Details
Closed on
Feb 14, 2007
Sold by
Kalbfleisch Brian and Minster Amy
Bought by
Carlson Grant M
Current Estimated Value
Home Financials for this Owner
Home Financials are based on the most recent Mortgage that was taken out on this home.
Original Mortgage
$211,200
Outstanding Balance
$127,271
Interest Rate
6.27%
Mortgage Type
Unknown
Estimated Equity
$289,583
Purchase Details
Closed on
Mar 31, 2003
Sold by
Barrette Todd A and Barrette Gina
Bought by
Kalbfleisch Brian
Home Financials for this Owner
Home Financials are based on the most recent Mortgage that was taken out on this home.
Original Mortgage
$230,860
Interest Rate
5.51%
Mortgage Type
FHA
Purchase Details
Closed on
May 29, 2001
Sold by
Barrette Todd A
Bought by
Barrette Todd A and Barrette Gina
Purchase Details
Closed on
Sep 22, 1999
Sold by
North Star Trust Company
Bought by
Barrett Todd A
Create a Home Valuation Report for This Property
The Home Valuation Report is an in-depth analysis detailing your home's value as well as a comparison with similar homes in the area
Home Values in the Area
Average Home Value in this Area
Purchase History
| Date | Buyer | Sale Price | Title Company |
|---|---|---|---|
| Carlson Grant M | $264,000 | Republic Title Co | |
| Kalbfleisch Brian | $238,000 | Multiple | |
| Barrette Todd A | -- | -- | |
| Barrett Todd A | $168,000 | -- |
Source: Public Records
Mortgage History
| Date | Status | Borrower | Loan Amount |
|---|---|---|---|
| Open | Carlson Grant M | $211,200 | |
| Previous Owner | Kalbfleisch Brian | $230,860 |
Source: Public Records
Tax History Compared to Growth
Tax History
| Year | Tax Paid | Tax Assessment Tax Assessment Total Assessment is a certain percentage of the fair market value that is determined by local assessors to be the total taxable value of land and additions on the property. | Land | Improvement |
|---|---|---|---|---|
| 2024 | $3,505 | $27,495 | $6,150 | $21,345 |
| 2023 | $3,394 | $19,868 | $2,827 | $17,041 |
| 2022 | $3,394 | $19,868 | $2,827 | $17,041 |
| 2021 | $3,336 | $19,866 | $2,826 | $17,040 |
| 2020 | $4,182 | $21,809 | $2,826 | $18,983 |
| 2019 | $4,171 | $24,117 | $2,826 | $21,291 |
| 2018 | $4,085 | $24,117 | $2,826 | $21,291 |
| 2017 | $4,506 | $24,309 | $2,479 | $21,830 |
| 2016 | $4,369 | $24,309 | $2,479 | $21,830 |
| 2015 | $3,974 | $24,309 | $2,479 | $21,830 |
| 2014 | $3,309 | $20,403 | $2,008 | $18,395 |
| 2013 | $3,233 | $20,403 | $2,008 | $18,395 |
Source: Public Records
Map
Nearby Homes
- 2710 N Artesian Ave
- 2712 N Artesian Ave Unit 3
- 2728 N Campbell Ave
- 2727 N Artesian Ave
- 2733 N Maplewood Ave
- 2444 W Diversey Ave Unit 1W
- 2554 W Logan Blvd Unit 402
- 2449 W Logan Blvd Unit 1F
- 2612 W Diversey Ave Unit 101
- 2820 N Rockwell St Unit 2
- 2337 W Wolfram St Unit 415
- 2337 W Wolfram St Unit 411
- 2826 N Rockwell St
- 2523 N Rockwell St
- 2828 N Talman Ave Unit D
- 2503 N Maplewood Ave
- 2864 N Riverwalk Dr
- 2801 N Oakley Ave Unit 202
- 2656 W Logan Blvd
- 2832 N Riverwalk Dr
- 2711 N Campbell Ave
- 2709 N Campbell Ave Unit 2
- 2709 N Campbell Ave Unit 1
- 2709 N Campbell Ave Unit 3
- 2711 N Campbell Ave
- 2713 N Campbell Ave
- 2707 N Campbell Ave Unit 2N
- 2707 N Campbell Ave Unit 3N
- 2715 N Campbell Ave
- 2705 N Campbell Ave Unit 1S
- 2705 N Campbell Ave Unit 2S
- 2719 N Campbell Ave Unit 1N
- 2701 N Campbell Ave Unit 1
- 2701 N Campbell Ave Unit 3
- 2701 N Campbell Ave Unit 2
- 2721 N Campbell Ave
- 2723 N Campbell Ave
- 2710 N Artesian Ave Unit 3
- 2710 N Artesian Ave Unit 2
- 2710 N Artesian Ave Unit 1E