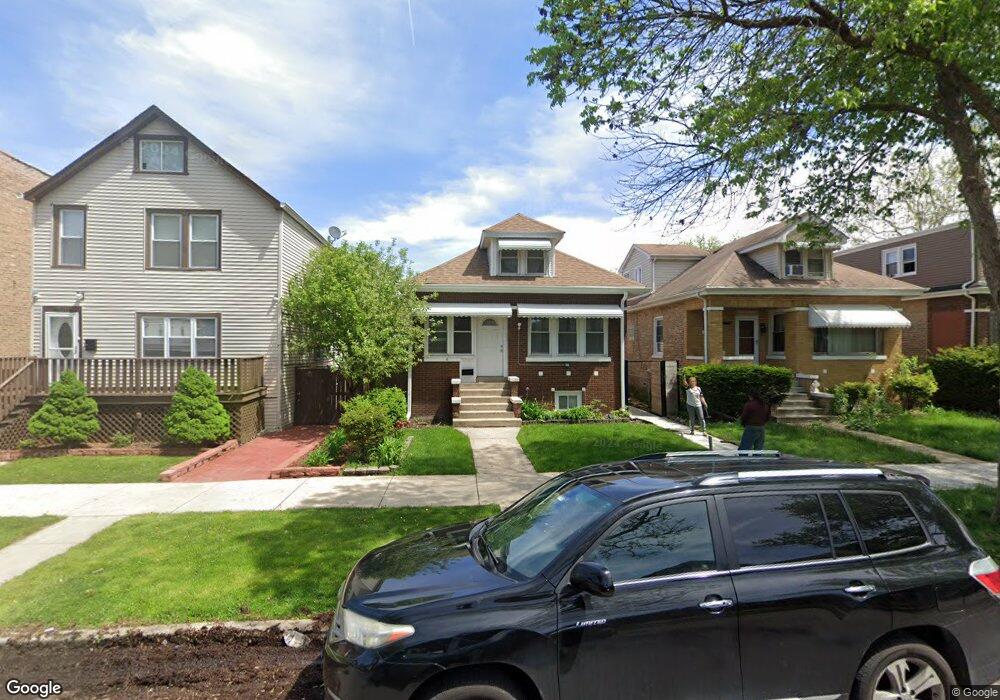
2707 N Marmora Ave Chicago, IL 60639
Belmont Central NeighborhoodEstimated Value: $364,000 - $466,000
4
Beds
2
Baths
1,495
Sq Ft
$267/Sq Ft
Est. Value
About This Home
This home is located at 2707 N Marmora Ave, Chicago, IL 60639 and is currently estimated at $399,776, approximately $267 per square foot. 2707 N Marmora Ave is a home located in Cook County with nearby schools including Lyon Elementary School, Steinmetz College Prep, and Horizon Science Academy-Belmont.
Ownership History
Date
Name
Owned For
Owner Type
Purchase Details
Closed on
Jan 18, 2024
Sold by
Martinez Rosa Maria and Martinez Rosa
Bought by
Chicago Title Land Trust
Current Estimated Value
Purchase Details
Closed on
Feb 13, 2014
Sold by
Rodriguez Rosa Miria and Martinez Maria Leticia
Bought by
Rodriguez Rosa Maria
Purchase Details
Closed on
Jul 30, 2001
Sold by
Roman Ciro and Roman Baldemar
Bought by
Martinez Adalberto
Home Financials for this Owner
Home Financials are based on the most recent Mortgage that was taken out on this home.
Original Mortgage
$103,000
Interest Rate
7.62%
Purchase Details
Closed on
Nov 11, 1994
Sold by
Quintanilla Hector and Quintanilla Dorina
Bought by
Roman Baldemar and Roman Ciro
Home Financials for this Owner
Home Financials are based on the most recent Mortgage that was taken out on this home.
Original Mortgage
$126,300
Interest Rate
8.91%
Create a Home Valuation Report for This Property
The Home Valuation Report is an in-depth analysis detailing your home's value as well as a comparison with similar homes in the area
Home Values in the Area
Average Home Value in this Area
Purchase History
| Date | Buyer | Sale Price | Title Company |
|---|---|---|---|
| Chicago Title Land Trust | -- | Chicago Title | |
| Rodriguez Rosa Maria | -- | Chicago Title Insurance Co | |
| Martinez Adalberto | $195,000 | -- | |
| Roman Baldemar | $136,500 | -- |
Source: Public Records
Mortgage History
| Date | Status | Borrower | Loan Amount |
|---|---|---|---|
| Previous Owner | Martinez Adalberto | $103,000 | |
| Previous Owner | Roman Baldemar | $126,300 |
Source: Public Records
Tax History Compared to Growth
Tax History
| Year | Tax Paid | Tax Assessment Tax Assessment Total Assessment is a certain percentage of the fair market value that is determined by local assessors to be the total taxable value of land and additions on the property. | Land | Improvement |
|---|---|---|---|---|
| 2024 | $5,211 | $31,000 | $7,570 | $23,430 |
| 2023 | $5,059 | $28,000 | $6,138 | $21,862 |
| 2022 | $5,059 | $28,000 | $6,138 | $21,862 |
| 2021 | $4,964 | $28,000 | $6,138 | $21,862 |
| 2020 | $4,326 | $22,509 | $4,501 | $18,008 |
| 2019 | $4,395 | $25,292 | $4,501 | $20,791 |
| 2018 | $4,320 | $25,292 | $4,501 | $20,791 |
| 2017 | $4,169 | $22,730 | $4,092 | $18,638 |
| 2016 | $4,055 | $22,730 | $4,092 | $18,638 |
| 2015 | $3,687 | $22,730 | $4,092 | $18,638 |
| 2014 | $3,723 | $22,619 | $3,682 | $18,937 |
| 2013 | $3,638 | $22,619 | $3,682 | $18,937 |
Source: Public Records
Map
Nearby Homes
- 2744 N Marmora Ave
- 2632 N Marmora Ave
- 5836 W Diversey Ave
- 2714 N Mango Ave
- 2728 N Mango Ave
- 2630 N Austin Ave
- 2735 N Mango Ave
- 2851 N Major Ave
- 2531 N Major Ave
- 2601 N Moody Ave
- 2852 N Meade Ave
- 2951 N Austin Ave
- 2612 N Moody Ave
- 2448 N Major Ave
- 2841 N Melvina Ave
- 5505 W Parker Ave
- 5512 W Wrightwood Ave
- 2730 N Merrimac Ave
- 2430 N Central Ave
- 2537 N Luna Ave
- 2711 N Marmora Ave
- 2705 N Marmora Ave
- 2701 N Marmora Ave Unit 1
- 2701 N Marmora Ave
- 2715 N Marmora Ave
- 2715 N Marmora Ave
- 2719 N Marmora Ave
- 2721 N Marmora Ave
- 2721 N Marmora Ave
- 2706 N Monitor Ave Unit 2
- 2710 N Monitor Ave
- 2704 N Monitor Ave
- 2704 N Monitor Ave
- 2700 N Monitor Ave Unit 1
- 2700 N Monitor Ave
- 2659 N Marmora Ave Unit 1
- 2725 N Marmora Ave
- 2714 N Monitor Ave
- 2708 N Marmora Ave
- 2704 N Marmora Ave