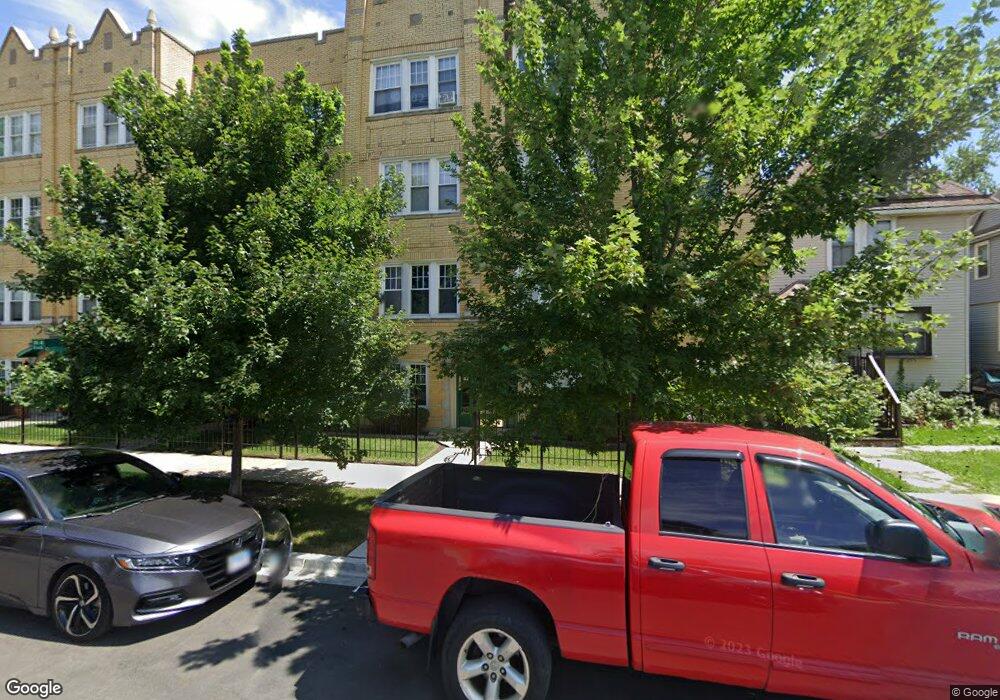
2707 S 59th Ct Unit 27073 Cicero, IL 60804
Estimated Value: $112,000 - $152,594
2
Beds
1
Bath
915
Sq Ft
$140/Sq Ft
Est. Value
About This Home
This home is located at 2707 S 59th Ct Unit 27073, Cicero, IL 60804 and is currently estimated at $128,399, approximately $140 per square foot. 2707 S 59th Ct Unit 27073 is a home located in Cook County with nearby schools including Goodwin Elementary School, Unity Jr High School, and J Sterling Morton Freshman Center.
Ownership History
Date
Name
Owned For
Owner Type
Purchase Details
Closed on
Apr 14, 2015
Sold by
Sill Robert and Dwyer Jessica
Bought by
Quinonez Patricia
Current Estimated Value
Purchase Details
Closed on
May 9, 2013
Sold by
Galindo Carlos and Galindo Michelle
Bought by
Sill Robert and Dwyer Jessica
Purchase Details
Closed on
May 10, 2002
Sold by
Hector Nava
Bought by
Carlos Galindo
Home Financials for this Owner
Home Financials are based on the most recent Mortgage that was taken out on this home.
Original Mortgage
$77,143
Interest Rate
6.87%
Mortgage Type
FHA
Purchase Details
Closed on
Dec 7, 1998
Sold by
Pinnacle Bank
Bought by
Nava Hector
Home Financials for this Owner
Home Financials are based on the most recent Mortgage that was taken out on this home.
Original Mortgage
$67,250
Interest Rate
6.83%
Mortgage Type
FHA
Create a Home Valuation Report for This Property
The Home Valuation Report is an in-depth analysis detailing your home's value as well as a comparison with similar homes in the area
Home Values in the Area
Average Home Value in this Area
Purchase History
| Date | Buyer | Sale Price | Title Company |
|---|---|---|---|
| Quinonez Patricia | $25,000 | Cti | |
| Sill Robert | $20,000 | Fidelity National Title | |
| Carlos Galindo | -- | -- | |
| Nava Hector | $69,000 | Chicago Title Insurance Co |
Source: Public Records
Mortgage History
| Date | Status | Borrower | Loan Amount |
|---|---|---|---|
| Previous Owner | Carlos Galindo | $77,143 | |
| Previous Owner | Nava Hector | $67,250 |
Source: Public Records
Tax History Compared to Growth
Tax History
| Year | Tax Paid | Tax Assessment Tax Assessment Total Assessment is a certain percentage of the fair market value that is determined by local assessors to be the total taxable value of land and additions on the property. | Land | Improvement |
|---|---|---|---|---|
| 2024 | $1,552 | $7,903 | $620 | $7,283 |
| 2023 | $1,251 | $7,903 | $620 | $7,283 |
| 2022 | $1,251 | $6,286 | $548 | $5,738 |
| 2021 | $1,275 | $6,284 | $547 | $5,737 |
| 2020 | $1,335 | $6,284 | $547 | $5,737 |
| 2019 | $1,676 | $6,864 | $504 | $6,360 |
| 2018 | $1,630 | $6,864 | $504 | $6,360 |
| 2017 | $1,596 | $6,864 | $504 | $6,360 |
| 2016 | $1,649 | $5,933 | $418 | $5,515 |
| 2015 | $1,569 | $5,933 | $418 | $5,515 |
| 2014 | $2,711 | $5,933 | $418 | $5,515 |
| 2013 | $1,484 | $6,221 | $418 | $5,803 |
Source: Public Records
Map
Nearby Homes
- 2632 S Austin Blvd
- 2730 S 58th Ct
- 2633 S 60th Ct
- 2816 S Austin Blvd
- 6032 W 28th St
- 2517 S 59th Ct
- 2504 S 57th Ct
- 2636 Lombard Ave
- 2407 S 60th Ct
- 2345 S 59th Ct
- 2407 S 61st Ave
- 2423 S 57th Ct
- 1307 S Harvey Ave
- 6238 26th St Unit 201
- 6238 W 26th St Unit 202
- 2613 Highland Ave
- 2419 S Lombard Ave
- 2321 S 60th Ct
- 2614 Highland Ave
- 5919 W Ogden Ave
- 2707 S 59th Ct Unit 27072
- 2707 S 59th Ct Unit 27071
- 2707 S 59th Ct Unit 3
- 2705 S 59th Ct Unit 27051
- 2705 S 59th Ct Unit 27052
- 2705 S 59th Ct Unit 27053
- 2705 S 59th Ct Unit 3
- 2705 S 59th Ct Unit 2
- 2705 S 59th Ct Unit 1
- 2703 S 59th Ct Unit 27031
- 2703 S 59th Ct Unit 27033
- 2703 S 59th Ct Unit 27032
- 2703 S 59th Ct Unit 3
- 2701 S 59th Ct Unit 27013
- 5919 W 27th St Unit 59192
- 5917 W 27th St Unit 59171
- 5919 W 27th St Unit 59191
- 2701 S 59th Ct Unit 27012
- 2701 S 59th Ct Unit 27011
- 5917 W 27th St Unit 59172