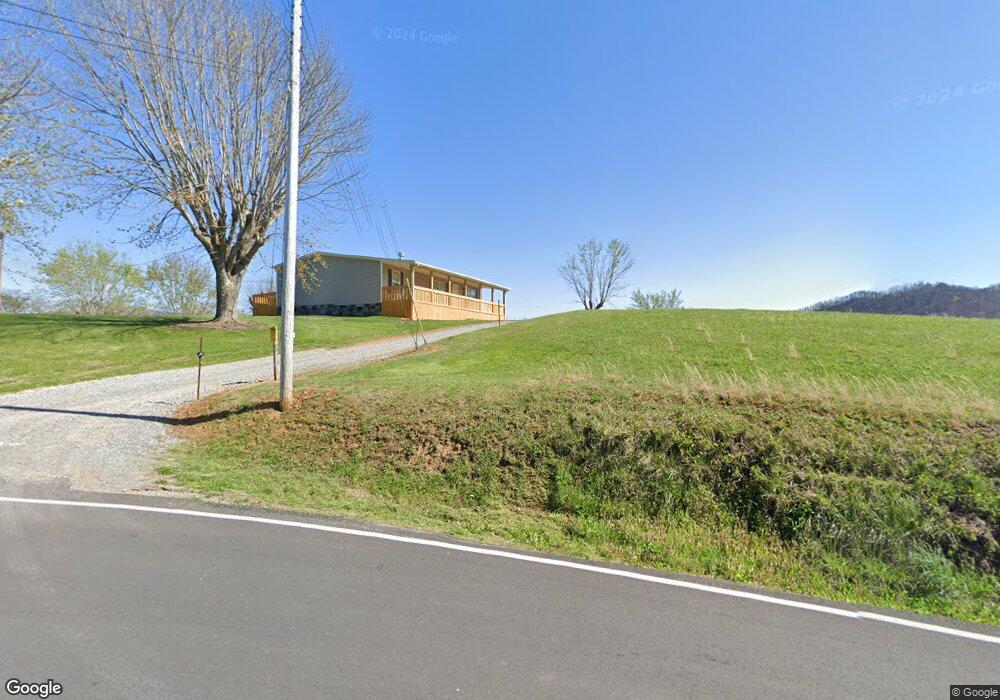
2708 Bogard Rd Newport, TN 37821
Estimated Value: $413,000 - $753,000
--
Bed
2
Baths
3,162
Sq Ft
$186/Sq Ft
Est. Value
About This Home
This home is located at 2708 Bogard Rd, Newport, TN 37821 and is currently estimated at $586,718, approximately $185 per square foot. 2708 Bogard Rd is a home located in Cocke County with nearby schools including Cosby Elementary School and Cosby High School.
Ownership History
Date
Name
Owned For
Owner Type
Purchase Details
Closed on
Apr 5, 2012
Sold by
Warren Charles E
Bought by
Manning Thomas P and Manning Carol L
Current Estimated Value
Purchase Details
Closed on
May 27, 2011
Sold by
Lebeau Richard
Bought by
Warren Charles E and Warren Mechelle
Home Financials for this Owner
Home Financials are based on the most recent Mortgage that was taken out on this home.
Original Mortgage
$299,570
Interest Rate
4.79%
Mortgage Type
VA
Purchase Details
Closed on
Apr 6, 2010
Sold by
Lebeau Richard
Bought by
Manning Thomas P
Purchase Details
Closed on
Dec 12, 2007
Sold by
Beau Richard
Bought by
Manning Thomas P
Purchase Details
Closed on
Jun 10, 2004
Sold by
Peterson Richard C
Bought by
Wells Richard H
Purchase Details
Closed on
Sep 18, 2003
Sold by
Lebeau Patricia M and Lebeau Richard
Bought by
Peterson Richard C
Purchase Details
Closed on
Dec 18, 2001
Sold by
Green Linda R
Bought by
Mabe Patricia
Purchase Details
Closed on
Jan 7, 1999
Sold by
York Alvin
Bought by
Green Linda Rose
Purchase Details
Closed on
Dec 15, 1998
Sold by
York Alvin
Bought by
York Alvin
Purchase Details
Closed on
Mar 4, 1996
Sold by
York Alvin
Bought by
Green Linda
Create a Home Valuation Report for This Property
The Home Valuation Report is an in-depth analysis detailing your home's value as well as a comparison with similar homes in the area
Home Values in the Area
Average Home Value in this Area
Purchase History
| Date | Buyer | Sale Price | Title Company |
|---|---|---|---|
| Manning Thomas P | $500 | -- | |
| Warren Charles E | $290,000 | -- | |
| Manning Thomas P | $35,000 | -- | |
| Manning Thomas P | -- | -- | |
| Wells Richard H | $65,000 | -- | |
| Peterson Richard C | $75,000 | -- | |
| Mabe Patricia | $91,700 | -- | |
| Green Linda Rose | $15,000 | -- | |
| York Alvin | $16,600 | -- | |
| Green Linda | $33,200 | -- |
Source: Public Records
Mortgage History
| Date | Status | Borrower | Loan Amount |
|---|---|---|---|
| Previous Owner | Warren Charles E | $299,570 |
Source: Public Records
Tax History Compared to Growth
Tax History
| Year | Tax Paid | Tax Assessment Tax Assessment Total Assessment is a certain percentage of the fair market value that is determined by local assessors to be the total taxable value of land and additions on the property. | Land | Improvement |
|---|---|---|---|---|
| 2024 | $2,036 | $79,550 | $8,625 | $70,925 |
| 2023 | $2,036 | $79,550 | $8,625 | $70,925 |
| 2022 | $2,040 | $79,550 | $8,625 | $70,925 |
| 2021 | $2,040 | $79,550 | $8,625 | $70,925 |
| 2020 | $2,040 | $79,550 | $8,625 | $70,925 |
| 2019 | $2,505 | $88,525 | $17,450 | $71,075 |
| 2018 | $2,505 | $88,525 | $17,450 | $71,075 |
| 2017 | $2,567 | $88,525 | $17,450 | $71,075 |
| 2016 | $2,201 | $88,525 | $17,450 | $71,075 |
| 2015 | $1,968 | $85,075 | $17,450 | $67,625 |
| 2014 | $1,968 | $85,075 | $17,450 | $67,625 |
| 2013 | $1,968 | $82,000 | $16,450 | $65,550 |
Source: Public Records
Map
Nearby Homes
- Lot 2 Bogard Rd
- Lot 3 Bogard Rd
- Lot 4 McGaha Chapel Rd
- 2544 Melody Way
- Lot 22 Symphony Way
- 1058 Clearview Dr
- Lot 36 English Fields Dr
- 0 English Fields Dr Unit 1295842
- 0 English Fields Dr Unit 305748
- 0 English Fields Dr Unit 707048
- 2720 Early Rd
- 146 Fancher Rd
- 3406 Bogard Rd
- 1120 Yellow Springs Rd
- 910 English Mountain Rd
- 3099 Mica Way
- 2977 Arch Rd
- 1607 Tranquility Ridge Way
- 992 Bogard Creek Rd
- 116 Circle Rd
- 2710 Bogard Rd
- 2688 Bogard Rd
- 2692 Bogard Rd
- 2700 Bogard Rd
- 2825 Lane Dr
- 462 Lower Bogard Rd Unit 468
- 2695 Bogard Rd
- 466 Lower Bogard Rd
- 2669 Booty Dr
- 2666 Bogard Rd
- 2725 Lane Dr
- 2815 Lane Dr
- 506 Lower Bogard Rd
- 2881 Lane Dr
- 2685 Bogard Rd
- 2735 Lane Dr
- 2671 Booty Dr
- 502 Lower Bogard Rd
- 2657 Booty Dr
- 2745 Lane Dr