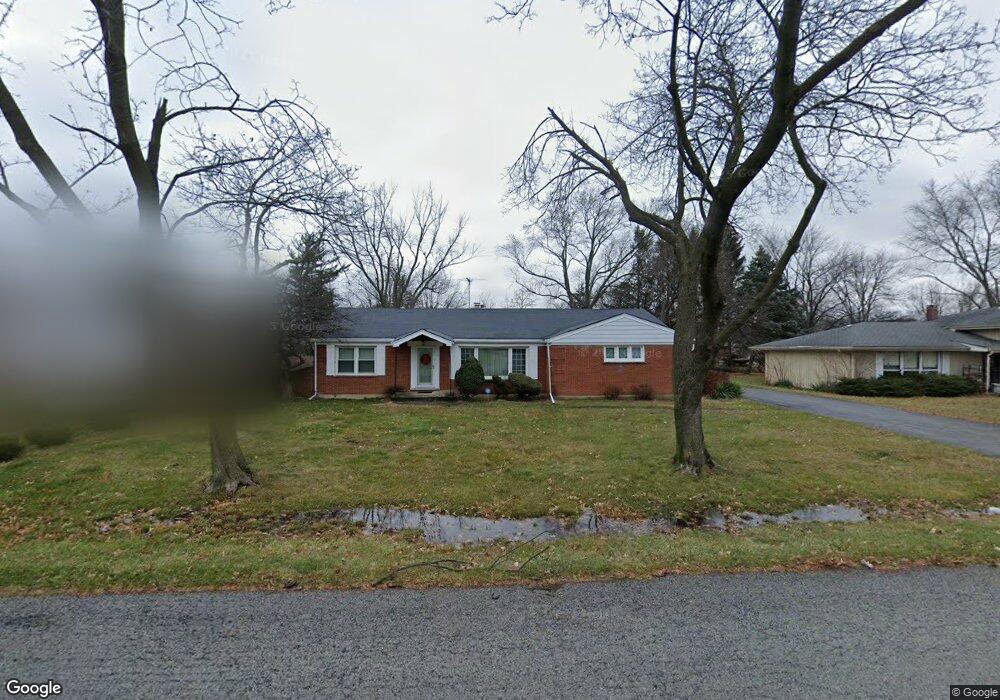
2709 Apollo Cir Olympia Fields, IL 60461
Estimated Value: $237,000 - $289,099
3
Beds
3
Baths
1,777
Sq Ft
$145/Sq Ft
Est. Value
About This Home
This home is located at 2709 Apollo Cir, Olympia Fields, IL 60461 and is currently estimated at $258,525, approximately $145 per square foot. 2709 Apollo Cir is a home located in Cook County with nearby schools including Illinois School, Indiana Elementary School, and Arcadia Elementary School.
Ownership History
Date
Name
Owned For
Owner Type
Purchase Details
Closed on
Aug 19, 2025
Sold by
Kennedy Carolyn
Bought by
1212 Incorporated
Current Estimated Value
Home Financials for this Owner
Home Financials are based on the most recent Mortgage that was taken out on this home.
Original Mortgage
$262,500
Outstanding Balance
$241,291
Interest Rate
6.72%
Mortgage Type
Construction
Estimated Equity
$17,234
Purchase Details
Closed on
Aug 26, 2005
Sold by
Kennedy Leslie L
Bought by
Kennedy Leslie L and Kennedy Carolyn
Home Financials for this Owner
Home Financials are based on the most recent Mortgage that was taken out on this home.
Original Mortgage
$150,001
Interest Rate
5.83%
Mortgage Type
New Conventional
Purchase Details
Closed on
Aug 17, 2002
Sold by
Kennedy Leslie L
Bought by
Kennedy Leslie L and Kennedy Carolyn
Home Financials for this Owner
Home Financials are based on the most recent Mortgage that was taken out on this home.
Original Mortgage
$106,000
Interest Rate
10.37%
Purchase Details
Closed on
Apr 22, 1995
Sold by
Thacker Carolyn L
Bought by
Kennedy Leslie L
Home Financials for this Owner
Home Financials are based on the most recent Mortgage that was taken out on this home.
Original Mortgage
$54,000
Interest Rate
8.39%
Create a Home Valuation Report for This Property
The Home Valuation Report is an in-depth analysis detailing your home's value as well as a comparison with similar homes in the area
Home Values in the Area
Average Home Value in this Area
Purchase History
| Date | Buyer | Sale Price | Title Company |
|---|---|---|---|
| 1212 Incorporated | $240,000 | Old Republic Title | |
| Kennedy Leslie L | -- | Lsi Title Agency Inc Il | |
| Kennedy Leslie L | -- | -- | |
| Kennedy Leslie L | -- | -- |
Source: Public Records
Mortgage History
| Date | Status | Borrower | Loan Amount |
|---|---|---|---|
| Open | 1212 Incorporated | $262,500 | |
| Previous Owner | Kennedy Leslie L | $150,001 | |
| Previous Owner | Kennedy Leslie L | $106,000 | |
| Previous Owner | Kennedy Leslie L | $54,000 |
Source: Public Records
Tax History
| Year | Tax Paid | Tax Assessment Tax Assessment Total Assessment is a certain percentage of the fair market value that is determined by local assessors to be the total taxable value of land and additions on the property. | Land | Improvement |
|---|---|---|---|---|
| 2025 | $7,411 | $22,100 | $6,997 | $15,103 |
| 2024 | $7,411 | $22,100 | $6,997 | $15,103 |
| 2023 | $3,845 | $23,000 | $6,997 | $16,003 |
| 2022 | $3,845 | $12,927 | $6,219 | $6,708 |
| 2021 | $3,907 | $12,927 | $6,219 | $6,708 |
| 2020 | $3,783 | $12,927 | $6,219 | $6,708 |
| 2019 | $4,063 | $13,926 | $5,830 | $8,096 |
| 2018 | $4,028 | $13,926 | $5,830 | $8,096 |
| 2017 | $4,430 | $14,882 | $5,830 | $9,052 |
| 2016 | $5,140 | $14,516 | $5,441 | $9,075 |
| 2015 | $7,440 | $19,360 | $5,441 | $13,919 |
| 2014 | $7,318 | $19,360 | $5,441 | $13,919 |
| 2013 | $5,358 | $16,512 | $5,441 | $11,071 |
Source: Public Records
Map
Nearby Homes
- 2709 Apollo Cir
- 2717 Apollo Cir
- 2701 Apollo Cir
- 2725 Apollo Cir
- 2640 Corinth Rd
- 2650 Corinth Rd
- 2638 Apollo Cir
- 2660 Corinth Rd
- 2714 Apollo Cir
- 2724 Apollo Cir
- 21045 Apollo Cir
- 2734 Apollo Cir
- 21025 Apollo Cir
- 21015 Apollo Cir
- 2670 Corinth Rd
- 2641 Corinth Rd
- 2744 Apollo Cir
- 2633 Corinth Rd
- 2661 Corinth Rd
Your Personal Tour Guide
Ask me questions while you tour the home.