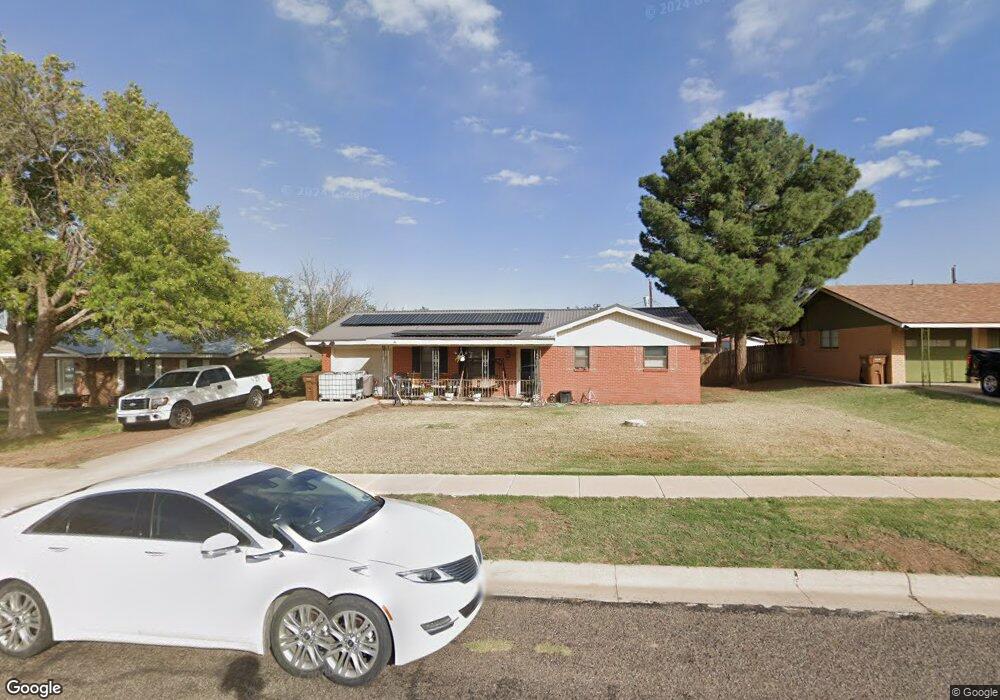
2709 Cindy Ln Big Spring, TX 79720
Estimated Value: $162,000 - $191,000
--
Bed
--
Bath
2,120
Sq Ft
$83/Sq Ft
Est. Value
About This Home
This home is located at 2709 Cindy Ln, Big Spring, TX 79720 and is currently estimated at $176,044, approximately $83 per square foot. 2709 Cindy Ln is a home located in Howard County with nearby schools including Big Spring High School.
Ownership History
Date
Name
Owned For
Owner Type
Purchase Details
Closed on
Apr 15, 2016
Sold by
Jolly Stacey and Best Stacey
Bought by
Martinez Philip J
Current Estimated Value
Home Financials for this Owner
Home Financials are based on the most recent Mortgage that was taken out on this home.
Original Mortgage
$108,007
Outstanding Balance
$85,295
Interest Rate
3.5%
Mortgage Type
FHA
Estimated Equity
$90,749
Purchase Details
Closed on
Dec 10, 2015
Sold by
Best Jeremiah D
Bought by
Jolly Stacy
Purchase Details
Closed on
Jun 6, 2008
Sold by
Burchett Richard D and The Estate Of Delbert Burchett
Bought by
Best Jeremiah D
Home Financials for this Owner
Home Financials are based on the most recent Mortgage that was taken out on this home.
Original Mortgage
$57,499
Interest Rate
6.08%
Mortgage Type
FHA
Create a Home Valuation Report for This Property
The Home Valuation Report is an in-depth analysis detailing your home's value as well as a comparison with similar homes in the area
Home Values in the Area
Average Home Value in this Area
Purchase History
| Date | Buyer | Sale Price | Title Company |
|---|---|---|---|
| Martinez Philip J | -- | Big Spring Abstract & Title | |
| Jolly Stacy | -- | Big Spring Abstract & Title | |
| Best Jeremiah D | -- | Big Spring Abstract |
Source: Public Records
Mortgage History
| Date | Status | Borrower | Loan Amount |
|---|---|---|---|
| Open | Martinez Philip J | $108,007 | |
| Previous Owner | Best Jeremiah D | $57,499 |
Source: Public Records
Tax History Compared to Growth
Tax History
| Year | Tax Paid | Tax Assessment Tax Assessment Total Assessment is a certain percentage of the fair market value that is determined by local assessors to be the total taxable value of land and additions on the property. | Land | Improvement |
|---|---|---|---|---|
| 2024 | $2,946 | $165,541 | $10,620 | $154,921 |
| 2023 | $2,955 | $171,388 | $8,875 | $162,513 |
| 2022 | $3,111 | $178,098 | $7,100 | $170,998 |
| 2021 | $3,256 | $138,560 | $7,100 | $131,460 |
| 2020 | $2,887 | $121,420 | $7,100 | $114,320 |
| 2019 | $2,719 | $107,483 | $7,100 | $100,383 |
| 2018 | $3,263 | $108,897 | $7,100 | $101,797 |
| 2017 | $3,039 | $103,240 | $7,100 | $96,140 |
| 2016 | $3,049 | $103,590 | $6,035 | $97,555 |
| 2015 | -- | $99,024 | $5,325 | $93,699 |
| 2014 | -- | $77,892 | $5,325 | $72,567 |
Source: Public Records
Map
Nearby Homes
- 2716 Cindy Ln
- 2306 Merrily Dr
- 2606 Carol Dr
- 2718 Central Dr
- 2806 Ann Dr
- 2509 Carol Dr
- 2704 Shirley Dr
- 2706 Shirley Dr
- 2702 Shirley Dr
- 2710 Shirley Dr
- 2502 Cindy Ln
- 2601 Central Dr
- 2405 E 25th St
- 2511 E 24th St
- 2308 Brent Dr
- 2608 E 24th St
- 0000 Los Alamitos Trail
- 2901 Stonehaven Dr
- Lot 31 Miami Cove
- Lot 25 Miami Cove