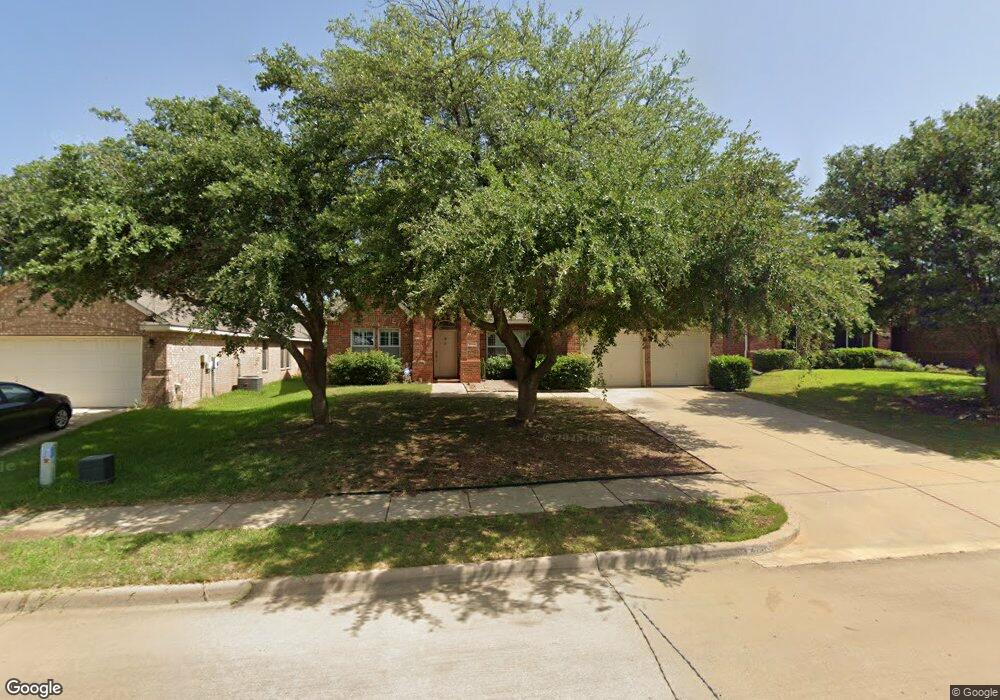
2709 Hereford Rd Denton, TX 76210
South Denton NeighborhoodEstimated Value: $393,000 - $409,000
3
Beds
2
Baths
2,086
Sq Ft
$191/Sq Ft
Est. Value
About This Home
This home is located at 2709 Hereford Rd, Denton, TX 76210 and is currently estimated at $398,715, approximately $191 per square foot. 2709 Hereford Rd is a home located in Denton County with nearby schools including Houston Elementary School, McMath Middle School, and Denton High School.
Ownership History
Date
Name
Owned For
Owner Type
Purchase Details
Closed on
Aug 31, 2010
Sold by
Wilbanks Dorothy Lewis
Bought by
Palaez John J and Pelaez Gloria Y
Current Estimated Value
Home Financials for this Owner
Home Financials are based on the most recent Mortgage that was taken out on this home.
Original Mortgage
$60,000
Outstanding Balance
$39,900
Interest Rate
4.58%
Mortgage Type
Seller Take Back
Estimated Equity
$358,815
Purchase Details
Closed on
Mar 12, 2008
Sold by
Ventrca Clinton J and Ventrca Shelley R
Bought by
Pelaez John J and Pelaez Gloria Y
Home Financials for this Owner
Home Financials are based on the most recent Mortgage that was taken out on this home.
Original Mortgage
$119,000
Interest Rate
5.67%
Mortgage Type
Purchase Money Mortgage
Purchase Details
Closed on
Nov 21, 2002
Sold by
Bowen Builders Group Of Texas Inc
Bought by
Ventrca Clinton J and Ventrca Shelley R
Home Financials for this Owner
Home Financials are based on the most recent Mortgage that was taken out on this home.
Original Mortgage
$156,353
Interest Rate
6.28%
Mortgage Type
FHA
Create a Home Valuation Report for This Property
The Home Valuation Report is an in-depth analysis detailing your home's value as well as a comparison with similar homes in the area
Home Values in the Area
Average Home Value in this Area
Purchase History
| Date | Buyer | Sale Price | Title Company |
|---|---|---|---|
| Palaez John J | -- | Ctot | |
| Pelaez John J | -- | Hftc | |
| Ventrca Clinton J | -- | -- |
Source: Public Records
Mortgage History
| Date | Status | Borrower | Loan Amount |
|---|---|---|---|
| Open | Palaez John J | $60,000 | |
| Previous Owner | Pelaez John J | $119,000 | |
| Previous Owner | Ventrca Clinton J | $156,353 |
Source: Public Records
Tax History Compared to Growth
Tax History
| Year | Tax Paid | Tax Assessment Tax Assessment Total Assessment is a certain percentage of the fair market value that is determined by local assessors to be the total taxable value of land and additions on the property. | Land | Improvement |
|---|---|---|---|---|
| 2025 | $5,775 | $397,242 | $77,616 | $334,005 |
| 2024 | $6,970 | $361,129 | $0 | $0 |
| 2023 | $5,072 | $328,299 | $77,616 | $302,158 |
| 2022 | $6,336 | $298,454 | $77,616 | $280,570 |
| 2021 | $6,032 | $271,704 | $57,506 | $214,198 |
| 2020 | $5,638 | $246,656 | $57,506 | $189,150 |
| 2019 | $5,751 | $241,044 | $57,506 | $183,538 |
| 2018 | $5,745 | $237,835 | $57,506 | $180,329 |
| 2017 | $5,457 | $220,756 | $36,950 | $183,806 |
| 2016 | $5,060 | $204,719 | $36,950 | $170,510 |
| 2015 | $4,184 | $186,108 | $36,950 | $149,158 |
| 2013 | -- | $161,767 | $36,950 | $124,817 |
Source: Public Records
Map
Nearby Homes
- 2804 Hollow Ridge Dr
- 2617 Hollow Ridge Dr
- 2617 Hereford Rd
- 2817 Hereford Rd
- 2721 Arabian Ave
- 2713 Hilcroft Ave
- 2616 Hilcroft Ave
- 2617 Bissonet Dr
- 3448 Tuscan Hills Cir
- 2601 Pinto Dr
- 3428 Tuscan Hills Cir
- 2713 Clubhouse Dr
- 3000 Bella Lago Dr
- 2913 Montebello Dr
- 2917 Montebello Dr
- 3009 Montebello Dr
- 2600 Pioneer Dr
- 2508 Pioneer Dr
- 2505 Pioneer Dr
- 3900 Gessner Dr
- 2713 Hereford Rd
- 2705 Hereford Rd
- 2708 Arabian Ave
- 2717 Hereford Rd
- 2712 Arabian Ave
- 2701 Hereford Rd
- 2704 Arabian Ave
- 2708 Hereford Rd
- 2716 Arabian Ave
- 2700 Arabian Ave
- 2712 Hereford Rd
- 2704 Hereford Rd
- 2721 Hereford Rd
- 2621 Hereford Rd
- 2716 Hereford Rd
- 2700 Hereford Rd
- 2720 Arabian Ave
- 2620 Arabian Ave
- 2720 Hereford Rd
- 2725 Hereford Rd