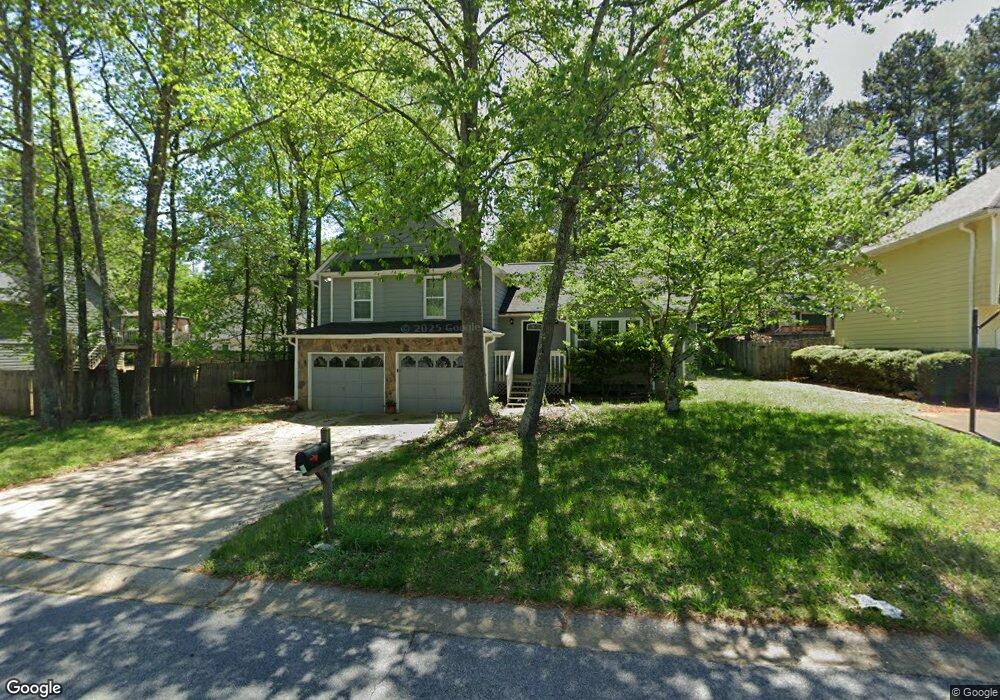
2709 Owens Ave SW Marietta, GA 30064
Estimated Value: $327,000 - $336,000
3
Beds
2
Baths
1,408
Sq Ft
$237/Sq Ft
Est. Value
About This Home
This home is located at 2709 Owens Ave SW, Marietta, GA 30064 and is currently estimated at $333,229, approximately $236 per square foot. 2709 Owens Ave SW is a home located in Cobb County with nearby schools including Hollydale Elementary School, Smitha Middle School, and Osborne High School.
Ownership History
Date
Name
Owned For
Owner Type
Purchase Details
Closed on
Nov 9, 2021
Sold by
Sfr Jv-1 Property Llc
Bought by
Sfr Jv-1 2021-1 Borrower Llc
Current Estimated Value
Purchase Details
Closed on
Sep 22, 2020
Sold by
Buyside Capital Advisors Llc
Bought by
Sfr Jv 1 Property Llc
Purchase Details
Closed on
Dec 12, 2019
Sold by
Taylor & Taylor Real Estate Enterprises
Bought by
2709 Owens Avenus Llc
Purchase Details
Closed on
Sep 7, 2016
Sold by
Taylor Vance
Purchase Details
Closed on
Dec 17, 2010
Sold by
Us Bank Na Trust 2004-1
Bought by
Taylor Vance
Purchase Details
Closed on
Jan 5, 2010
Sold by
Rothacker Kristen
Bought by
Us Bk National Assn
Purchase Details
Closed on
Nov 30, 1999
Sold by
Navarre Firmin J
Bought by
Rothacker Kristen L
Home Financials for this Owner
Home Financials are based on the most recent Mortgage that was taken out on this home.
Original Mortgage
$119,300
Interest Rate
7.94%
Mortgage Type
FHA
Create a Home Valuation Report for This Property
The Home Valuation Report is an in-depth analysis detailing your home's value as well as a comparison with similar homes in the area
Home Values in the Area
Average Home Value in this Area
Purchase History
| Date | Buyer | Sale Price | Title Company |
|---|---|---|---|
| Sfr Jv-1 2021-1 Borrower Llc | -- | Os National Llc | |
| Sfr Jv 1 Property Llc | $197,500 | None Available | |
| Buyside Capital Advisors Llc | $190,000 | None Available | |
| 2709 Owens Avenus Llc | -- | -- | |
| -- | -- | -- | |
| Taylor Vance | $68,300 | -- | |
| Us Bk National Assn | $67,649 | -- | |
| Rothacker Kristen L | $120,900 | -- |
Source: Public Records
Mortgage History
| Date | Status | Borrower | Loan Amount |
|---|---|---|---|
| Previous Owner | Rothacker Kristen L | $119,300 |
Source: Public Records
Tax History Compared to Growth
Tax History
| Year | Tax Paid | Tax Assessment Tax Assessment Total Assessment is a certain percentage of the fair market value that is determined by local assessors to be the total taxable value of land and additions on the property. | Land | Improvement |
|---|---|---|---|---|
| 2025 | $4,031 | $133,772 | $31,200 | $102,572 |
| 2024 | $4,033 | $133,772 | $31,200 | $102,572 |
| 2023 | $3,317 | $110,024 | $11,200 | $98,824 |
| 2022 | $2,276 | $75,008 | $11,200 | $63,808 |
| 2021 | $2,276 | $75,008 | $11,200 | $63,808 |
| 2020 | $1,905 | $62,784 | $11,200 | $51,584 |
| 2019 | $1,905 | $62,784 | $11,200 | $51,584 |
| 2018 | $1,503 | $49,536 | $11,200 | $38,336 |
| 2017 | $1,264 | $43,968 | $8,000 | $35,968 |
| 2016 | $1,264 | $43,968 | $8,000 | $35,968 |
| 2015 | $843 | $28,620 | $8,000 | $20,620 |
| 2014 | $850 | $28,620 | $0 | $0 |
Source: Public Records
Map
Nearby Homes
- 2705 Owens Ave SW
- 2599 Candler Way SW
- 2672 Holmes Mill Place SW
- 2614 Smith Ave SW
- 2625 Deerfield Cir SW
- 2730 Hembree Rd SW
- 2752 Owens Ave SW Unit 5
- 2554 Red Barn Rd SW
- 2723 Horseshoe Creek Dr SW
- 2626 Smith Ave SW
- 2608 Foxwood Place SW Unit IV
- 2448 Wood Meadows Dr SW
- 2450 Horseshoe Bend Rd SW
- 0 Red Barn Rd SW Unit 7583499
- 0 Red Barn Rd SW Unit 10526807
- 3272 Barnwell Trace
- 3106 Yellowhammer Dr Unit 28
- 3118 Yellowhammer Dr Unit 25
- Stratford Plan at Barrett Cove
- Sudbury Plan at Barrett Cove
- 2709 Owens Dr
- 2711 Owens Ave SW
- 2706 Candler Ct SW
- 2708 Candler Ct SW Unit 2
- 2704 Candler Ct SW Unit 2
- 2713 Owens Ave SW
- 2700 Candler Ct
- 2710 Owens Ave SW
- 2708 Owens Ave SW
- 2710 Candler Ct SW
- 0 Candler Ct Unit 8976812
- 0 Candler Ct Unit 3186614
- 0 Candler Ct
- 2715 Owens Ave SW
- 2694 Owens Ave SW
- 2695 Owens Ave SW
- 2697 Candler Dr SW
- 2709 Candler Ct SW
- 2707 Candler Ct SW
- 2698 Candler Dr SW