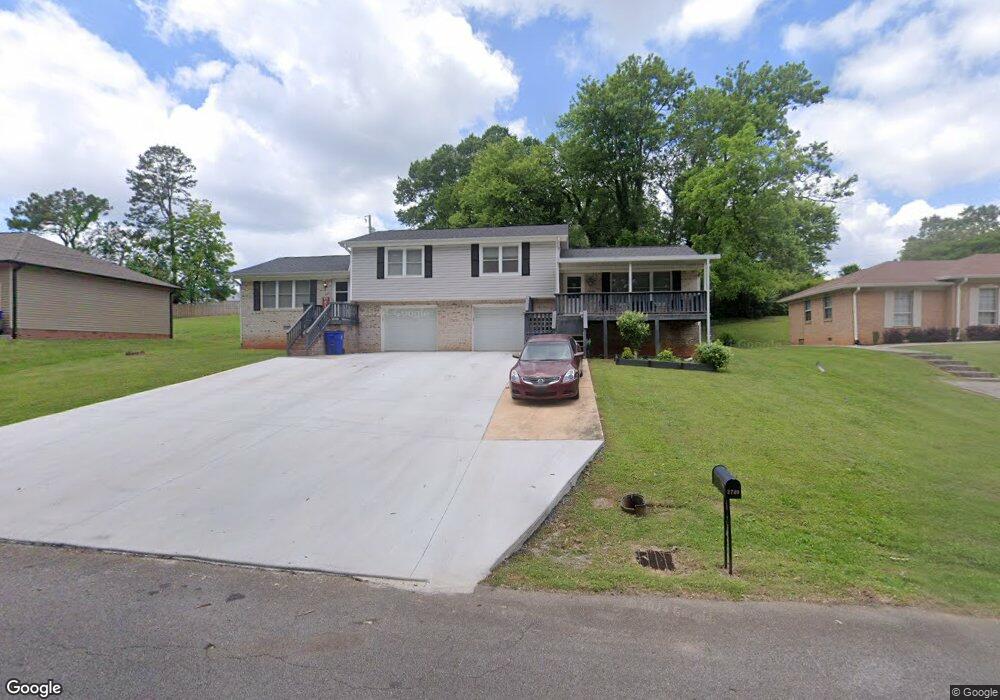
2709 Pine Dr NE Cleveland, TN 37312
Estimated Value: $249,829 - $378,000
--
Bed
2
Baths
2,300
Sq Ft
$129/Sq Ft
Est. Value
About This Home
This home is located at 2709 Pine Dr NE, Cleveland, TN 37312 and is currently estimated at $296,276, approximately $128 per square foot. 2709 Pine Dr NE is a home located in Bradley County with nearby schools including Mayfield Elementary School, Bowman Hills School, and United Christian Academy.
Ownership History
Date
Name
Owned For
Owner Type
Purchase Details
Closed on
May 31, 2017
Sold by
Ctt Investment
Bought by
Angelle Patti J
Current Estimated Value
Home Financials for this Owner
Home Financials are based on the most recent Mortgage that was taken out on this home.
Original Mortgage
$125,650
Outstanding Balance
$103,611
Interest Rate
3.97%
Mortgage Type
New Conventional
Estimated Equity
$192,665
Purchase Details
Closed on
Aug 12, 2016
Sold by
Banther William P
Bought by
Ctt Investments
Purchase Details
Closed on
May 16, 2016
Sold by
Witt Sherra A
Bought by
Banther William P
Purchase Details
Closed on
Apr 27, 2016
Sold by
Witt Scot
Bought by
Witt Sherra A
Purchase Details
Closed on
Mar 12, 2004
Sold by
Witt Sherra A
Bought by
Witt Scot
Home Financials for this Owner
Home Financials are based on the most recent Mortgage that was taken out on this home.
Original Mortgage
$77,600
Interest Rate
5.62%
Create a Home Valuation Report for This Property
The Home Valuation Report is an in-depth analysis detailing your home's value as well as a comparison with similar homes in the area
Home Values in the Area
Average Home Value in this Area
Purchase History
| Date | Buyer | Sale Price | Title Company |
|---|---|---|---|
| Angelle Patti J | $185,000 | None Available | |
| Ctt Investments | $120,000 | -- | |
| Banther William P | $75,000 | -- | |
| Witt Sherra A | -- | -- | |
| Witt Scot | $97,000 | -- |
Source: Public Records
Mortgage History
| Date | Status | Borrower | Loan Amount |
|---|---|---|---|
| Open | Angelle Patti J | $125,650 | |
| Previous Owner | Witt Scot | $77,600 |
Source: Public Records
Tax History Compared to Growth
Tax History
| Year | Tax Paid | Tax Assessment Tax Assessment Total Assessment is a certain percentage of the fair market value that is determined by local assessors to be the total taxable value of land and additions on the property. | Land | Improvement |
|---|---|---|---|---|
| 2025 | $351 | $90,520 | $17,600 | $72,920 |
| 2024 | $351 | $24,400 | $12,800 | $11,600 |
| 2023 | $769 | $24,400 | $12,800 | $11,600 |
| 2022 | $769 | $24,400 | $12,800 | $11,600 |
| 2021 | $769 | $24,400 | $0 | $0 |
| 2020 | $1,457 | $24,400 | $0 | $0 |
| 2019 | $1,457 | $37,920 | $0 | $0 |
| 2018 | $1,562 | $0 | $0 | $0 |
| 2017 | $780 | $0 | $0 | $0 |
| 2016 | $939 | $0 | $0 | $0 |
| 2015 | $483 | $0 | $0 | $0 |
| 2014 | $482 | $0 | $0 | $0 |
Source: Public Records
Map
Nearby Homes
- 2809 Pine Dr NE
- 2719 Ridge Park Dr
- 3005 Pine Dr NE
- 3010 Pine Dr NE
- 3010 Clearwater Dr NE
- 2702 Ocoee St N
- 6 NE Parkside Place
- Lot 12 Ridge Park Dr NE
- 3350 Serenity Dr NE
- 3376 Serenity Dr NE
- 3346 Harmony Ct NE
- 701 Weeks Dr NE
- 709 Weeks Dr NE
- 3 Weeks Dr NE
- 3366 Steeple Cir NE
- 3370 Steeple Cir NE
- 3362 Steeple Cir NE
- 3302 Steeple Cir NE
- 3358 Steeple Cir NE
- 741 Weeks Dr NE
- 2709 Pine Dr NE
- 2707/2709 Pine Dr NE
- 2707/2709 Pine Dr NE Unit 4
- 2707/2709 Pine Dr NE Unit 1
- 2701 Pine Dr NE
- 2605 Pine Dr NE
- 2703 Pine Dr NE
- 2702 Pine Dr NE
- 2705 Pine Dr NE
- 2606 Pine Dr NE
- 2704 Pine Dr NE
- 2603 Pine Dr NE
- 2700 Highland Dr NE
- 2606 Highland Dr NE
- 2602 Pine Dr NE
- 2702 Highland Dr NE
- 2975 Cross Creek Ct
- 2706 Pine Dr NE
- 9 Pine Dr
- 2975 Cross Creek Ct NE