
Seller's Agent in 2013
John Lindstrand
CB Sea Coast Advantage CF
(843) 902-8980
9 in this area
55 Total Sales


Estimated Value: $692,000 - $915,230
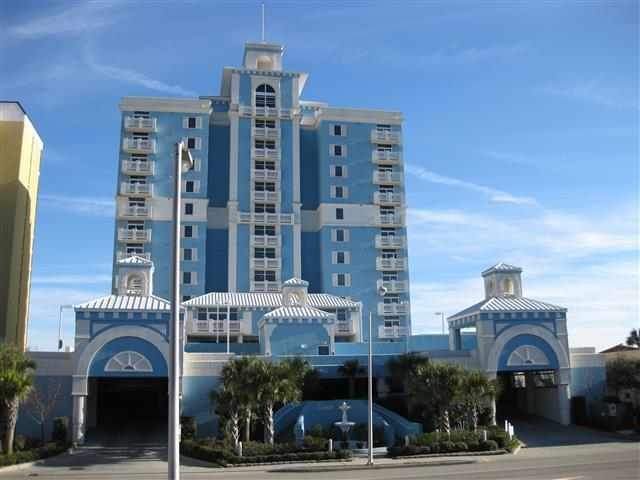
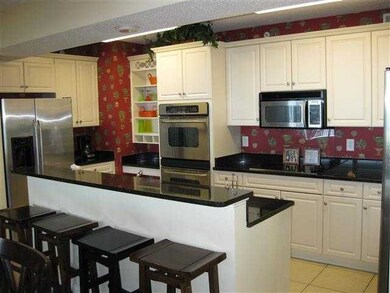
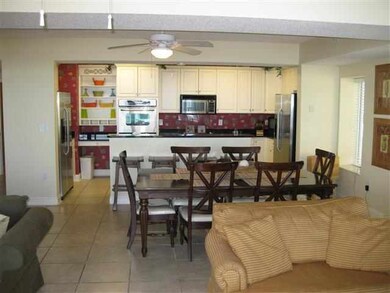
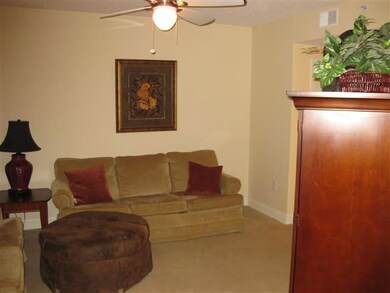
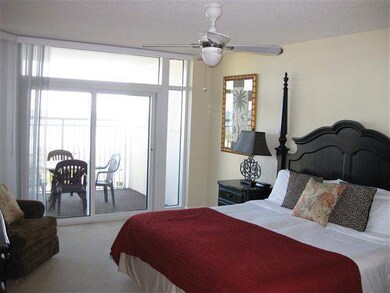
This home is located at 2709 S Ocean Blvd Unit 201, Myrtle Beach, SC 29577 since 28 January 2013 and is currently estimated at $775,077, approximately $303 per square foot. This property was built in 2007. 2709 S Ocean Blvd Unit 201 is a home located in Horry County with nearby schools including Myrtle Beach Child Development Center, Myrtle Beach Primary School, and Myrtle Beach Elementary School.
Last Agent to Sell the Property
CB Sea Coast Advantage CF License #58311 Listed on: 01/28/2013
| Date | Buyer | Sale Price | Title Company |
|---|---|---|---|
| Groves Carl | $450,000 | -- | |
| Groves Carl | $450,000 | -- | |
| Sanker David | $995,000 | None Available | |
| Winchester Ocean Blue Development Corp | $5,900,000 | -- |
| Date | Status | Borrower | Loan Amount |
|---|---|---|---|
| Open | Groves Carl | $275,000 | |
| Previous Owner | Sanker David | $99,500 | |
| Previous Owner | Sanker David | $796,000 |
| Date | Event | Price | List to Sale | Price per Sq Ft |
|---|---|---|---|---|
| 09/04/2013 09/04/13 | Sold | $450,000 | -16.7% | $176 / Sq Ft |
| 05/11/2013 05/11/13 | Pending | -- | -- | -- |
| 01/28/2013 01/28/13 | For Sale | $539,900 | -- | $212 / Sq Ft |
| Year | Tax Paid | Tax Assessment Tax Assessment Total Assessment is a certain percentage of the fair market value that is determined by local assessors to be the total taxable value of land and additions on the property. | Land | Improvement |
|---|---|---|---|---|
| 2024 | $8,585 | $42,900 | $0 | $42,900 |
| 2023 | $8,585 | $51,450 | $0 | $51,450 |
| 2021 | $7,925 | $51,450 | $0 | $51,450 |
| 2020 | $7,558 | $51,450 | $0 | $51,450 |
| 2019 | $7,558 | $51,450 | $0 | $51,450 |
| 2018 | $6,783 | $44,625 | $0 | $44,625 |
| 2017 | $6,707 | $25,500 | $0 | $25,500 |
| 2016 | -- | $25,500 | $0 | $25,500 |
| 2015 | $6,630 | $44,625 | $0 | $44,625 |
| 2014 | $6,446 | $25,500 | $0 | $25,500 |
Seller's Agent in 2013
John Lindstrand
CB Sea Coast Advantage CF
(843) 902-8980
9 in this area
55 Total Sales
Source: Coastal Carolinas Association of REALTORS®
MLS Number: 1301792
APN: 186-08-01-454
Disclaimer: Certain information contained herein is derived from information provided by parties other than Homes.com. All information provided is deemed reliable, but is not guaranteed to be accurate and should be independently verified.
![]() Provided courtesy of the Coastal Carolinas MLS. Copyright 2025 of the Coastal Carolinas MLS. All rights reserved. Information is provided exclusively for consumers' personal, non-commercial use, and may not be used for any purpose other than to identify prospective properties consumers may be interested in purchasing, and that the data is deemed reliable but is not guaranteed accurate by the Coastal Carolinas MLS.
Provided courtesy of the Coastal Carolinas MLS. Copyright 2025 of the Coastal Carolinas MLS. All rights reserved. Information is provided exclusively for consumers' personal, non-commercial use, and may not be used for any purpose other than to identify prospective properties consumers may be interested in purchasing, and that the data is deemed reliable but is not guaranteed accurate by the Coastal Carolinas MLS.