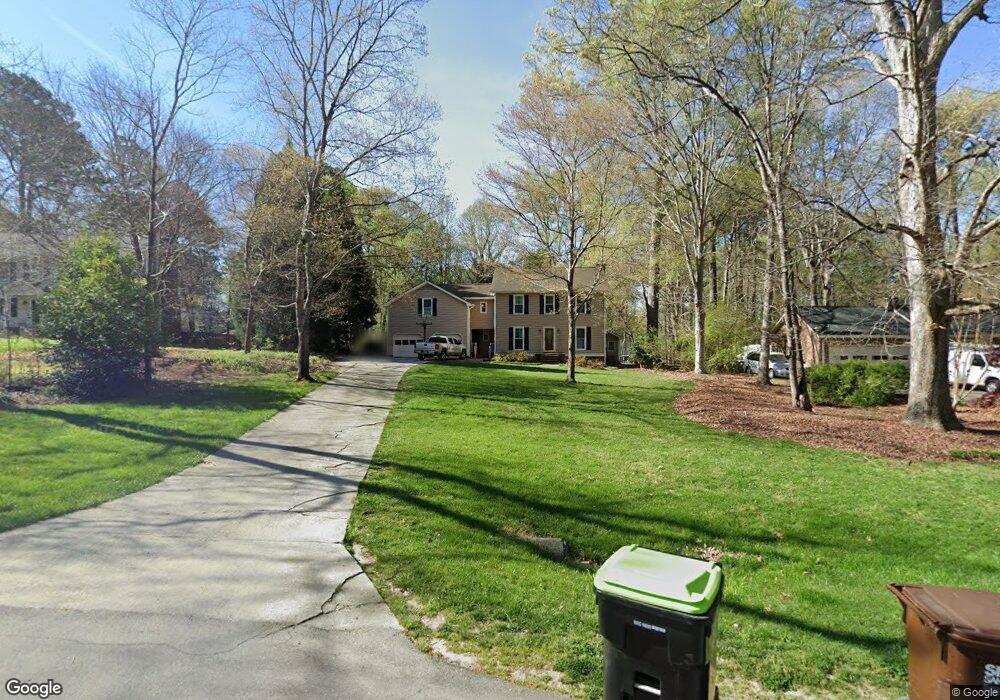
2709 Salisbury Plain Raleigh, NC 27613
Stonehenge NeighborhoodEstimated Value: $570,000 - $650,000
4
Beds
3
Baths
2,624
Sq Ft
$237/Sq Ft
Est. Value
About This Home
This home is located at 2709 Salisbury Plain, Raleigh, NC 27613 and is currently estimated at $622,747, approximately $237 per square foot. 2709 Salisbury Plain is a home located in Wake County with nearby schools including Jeffreys Grove Elementary School, Carroll Middle, and Sanderson High School.
Ownership History
Date
Name
Owned For
Owner Type
Purchase Details
Closed on
Nov 25, 2005
Sold by
Booger Leif and Booger Whitney
Bought by
Willis Matthew H and Willis Andra J
Current Estimated Value
Home Financials for this Owner
Home Financials are based on the most recent Mortgage that was taken out on this home.
Original Mortgage
$160,000
Outstanding Balance
$88,186
Interest Rate
6.04%
Mortgage Type
Fannie Mae Freddie Mac
Estimated Equity
$534,561
Purchase Details
Closed on
Oct 29, 2004
Sold by
Household Realty Corp
Bought by
Booger Leif and Booger Whitney
Home Financials for this Owner
Home Financials are based on the most recent Mortgage that was taken out on this home.
Original Mortgage
$182,400
Interest Rate
6.62%
Mortgage Type
Purchase Money Mortgage
Purchase Details
Closed on
Feb 17, 2004
Sold by
Wildman Stewart M and Wildman Annette
Bought by
Household Realty Corp
Create a Home Valuation Report for This Property
The Home Valuation Report is an in-depth analysis detailing your home's value as well as a comparison with similar homes in the area
Home Values in the Area
Average Home Value in this Area
Purchase History
| Date | Buyer | Sale Price | Title Company |
|---|---|---|---|
| Willis Matthew H | $290,000 | None Available | |
| Booger Leif | $228,000 | -- | |
| Household Realty Corp | $223,439 | -- |
Source: Public Records
Mortgage History
| Date | Status | Borrower | Loan Amount |
|---|---|---|---|
| Open | Willis Matthew H | $160,000 | |
| Previous Owner | Booger Leif | $182,400 | |
| Closed | Booger Leif | $45,600 |
Source: Public Records
Tax History Compared to Growth
Tax History
| Year | Tax Paid | Tax Assessment Tax Assessment Total Assessment is a certain percentage of the fair market value that is determined by local assessors to be the total taxable value of land and additions on the property. | Land | Improvement |
|---|---|---|---|---|
| 2025 | $3,771 | $586,485 | $200,000 | $386,485 |
| 2024 | $3,662 | $586,485 | $200,000 | $386,485 |
| 2023 | $3,107 | $395,891 | $100,000 | $295,891 |
| 2022 | $2,879 | $395,891 | $100,000 | $295,891 |
| 2021 | $2,802 | $395,891 | $100,000 | $295,891 |
| 2020 | $2,756 | $395,891 | $100,000 | $295,891 |
| 2019 | $2,731 | $332,003 | $100,000 | $232,003 |
| 2018 | $2,511 | $332,003 | $100,000 | $232,003 |
| 2017 | $2,381 | $332,003 | $100,000 | $232,003 |
| 2016 | $2,332 | $332,003 | $100,000 | $232,003 |
| 2015 | $2,155 | $307,484 | $86,000 | $221,484 |
| 2014 | -- | $307,484 | $86,000 | $221,484 |
Source: Public Records
Map
Nearby Homes
- 2704 Smokey Ridge Rd
- 8404 Sleepy Creek Dr
- 8100 Laurel Mountain Rd
- 7628 Valview St
- 7740 Wilderness Rd
- 7741 Wilderness Rd
- 8605 Brookdale Dr
- 3008 Eden Harbor Ct
- 7771 Falcon Rest Cir Unit 7771
- 8604 Wellsley Way
- 7601 Valview St
- 2610 Sawmill Rd
- 8920 Taymouth Ct
- 7401 Ray Rd
- 2204 Middlefield Ct
- 2609 Cobworth Ct
- 2428 Havershire Dr
- 8326 Ray Rd
- 7922 Footman Way
- 6901 Saxby Ct
- 2707 Salisbury Plain
- 8004 Chadbourne Ct
- 2708 Scottsdale Ln
- 2717 Salisbury Plain
- 2712 Salisbury Plain
- 2705 Salisbury Plain
- 8008 Chadbourne Ct
- 2704 Scottsdale Ln
- 2716 Salisbury Plain
- 2708 Salisbury Plain
- 2712 Scottsdale Ln
- 2721 Salisbury Plain
- 2704 Salisbury Plain
- 2701 Salisbury Plain
- 8009 New London Ln
- 8009 Chadbourne Ct
- 2720 Salisbury Plain
- 2716 Scottsdale Ln
- 2724 Salisbury Plain
- 8335 Morgans Way