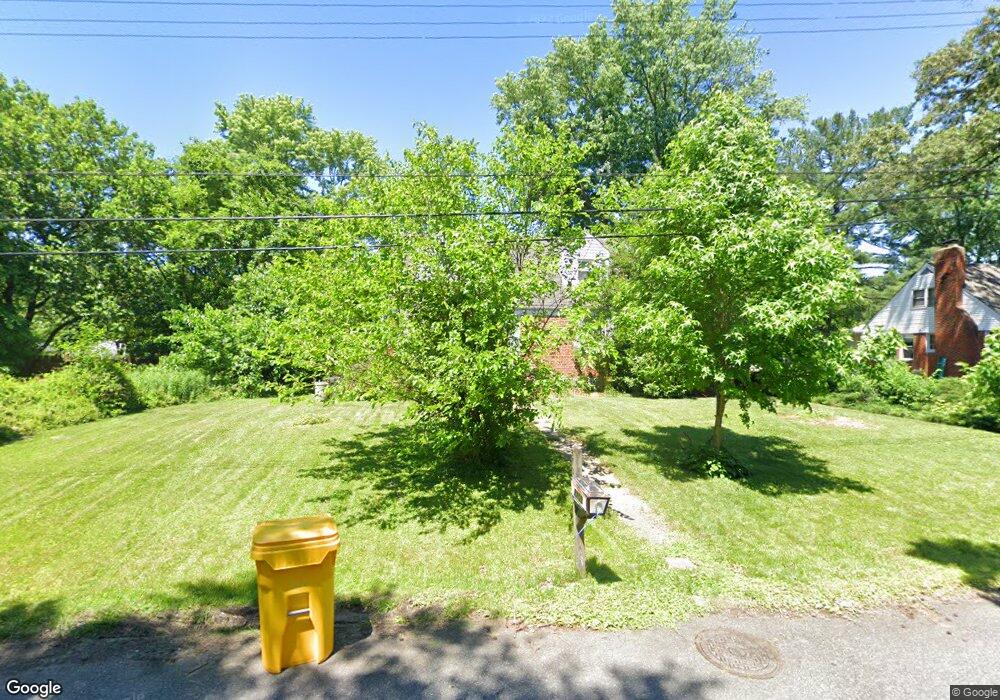
2709 Wren Way Glen Burnie, MD 21060
Estimated Value: $341,504 - $419,000
--
Bed
2
Baths
1,385
Sq Ft
$272/Sq Ft
Est. Value
About This Home
This home is located at 2709 Wren Way, Glen Burnie, MD 21060 and is currently estimated at $376,376, approximately $271 per square foot. 2709 Wren Way is a home located in Anne Arundel County with nearby schools including Marley Elementary School, Marley Middle School, and Glen Burnie High School.
Ownership History
Date
Name
Owned For
Owner Type
Purchase Details
Closed on
Jun 18, 2019
Sold by
Smith Brian Bernard and Smith Vicki Y Hong
Bought by
Smith Vicki Y Hong
Current Estimated Value
Home Financials for this Owner
Home Financials are based on the most recent Mortgage that was taken out on this home.
Original Mortgage
$95,000
Interest Rate
3.5%
Mortgage Type
Assumption
Purchase Details
Closed on
Sep 30, 1994
Sold by
Gargano Luciano
Bought by
Smith Brian B
Home Financials for this Owner
Home Financials are based on the most recent Mortgage that was taken out on this home.
Original Mortgage
$109,381
Interest Rate
8.5%
Purchase Details
Closed on
May 10, 1993
Sold by
Neukam Donald A
Bought by
Gargano Luciano
Home Financials for this Owner
Home Financials are based on the most recent Mortgage that was taken out on this home.
Original Mortgage
$112,000
Interest Rate
7.42%
Create a Home Valuation Report for This Property
The Home Valuation Report is an in-depth analysis detailing your home's value as well as a comparison with similar homes in the area
Home Values in the Area
Average Home Value in this Area
Purchase History
| Date | Buyer | Sale Price | Title Company |
|---|---|---|---|
| Smith Vicki Y Hong | $88,356 | Equity National Title | |
| Smith Brian B | $126,500 | -- | |
| Gargano Luciano | $113,000 | -- |
Source: Public Records
Mortgage History
| Date | Status | Borrower | Loan Amount |
|---|---|---|---|
| Previous Owner | Smith Vicki Y Hong | $95,000 | |
| Previous Owner | Smith Brian B | $227,100 | |
| Previous Owner | Smith Brian B | $109,381 | |
| Previous Owner | Gargano Luciano | $112,000 |
Source: Public Records
Tax History Compared to Growth
Tax History
| Year | Tax Paid | Tax Assessment Tax Assessment Total Assessment is a certain percentage of the fair market value that is determined by local assessors to be the total taxable value of land and additions on the property. | Land | Improvement |
|---|---|---|---|---|
| 2025 | $2,727 | $305,900 | $152,200 | $153,700 |
| 2024 | $2,727 | $289,567 | $0 | $0 |
| 2023 | $2,637 | $273,233 | $0 | $0 |
| 2022 | $2,451 | $256,900 | $122,200 | $134,700 |
| 2021 | $4,819 | $250,200 | $0 | $0 |
| 2020 | $2,328 | $243,500 | $0 | $0 |
| 2019 | $2,289 | $236,800 | $112,200 | $124,600 |
| 2018 | $2,368 | $233,567 | $0 | $0 |
| 2017 | $2,147 | $230,333 | $0 | $0 |
| 2016 | -- | $227,100 | $0 | $0 |
| 2015 | -- | $223,767 | $0 | $0 |
| 2014 | -- | $220,433 | $0 | $0 |
Source: Public Records
Map
Nearby Homes
- 206 Sandsbury Ave
- 100 Sandsbury Ave
- 7911 Ritchie Hwy
- 1921 Norwich Rd
- 1909 Pagham Rd
- 1701 Norfolk Rd
- 0 Bertram Ave Unit MDAA2112598
- 1731 Saunders Way
- 90 Foxchase Ct
- 1613 Kimber Rd
- 32 1st Ave
- 8918 Twin Ridge Dr
- 1702 Manning Rd
- 1612 Lorimer Rd
- 201 Nina Ct
- 7739 Overhill Rd
- 221 Gunther Place
- 221 Foxmanor Ln
- 220 Foxtree Dr
- 1102 Castle Harbour Way Unit 3D