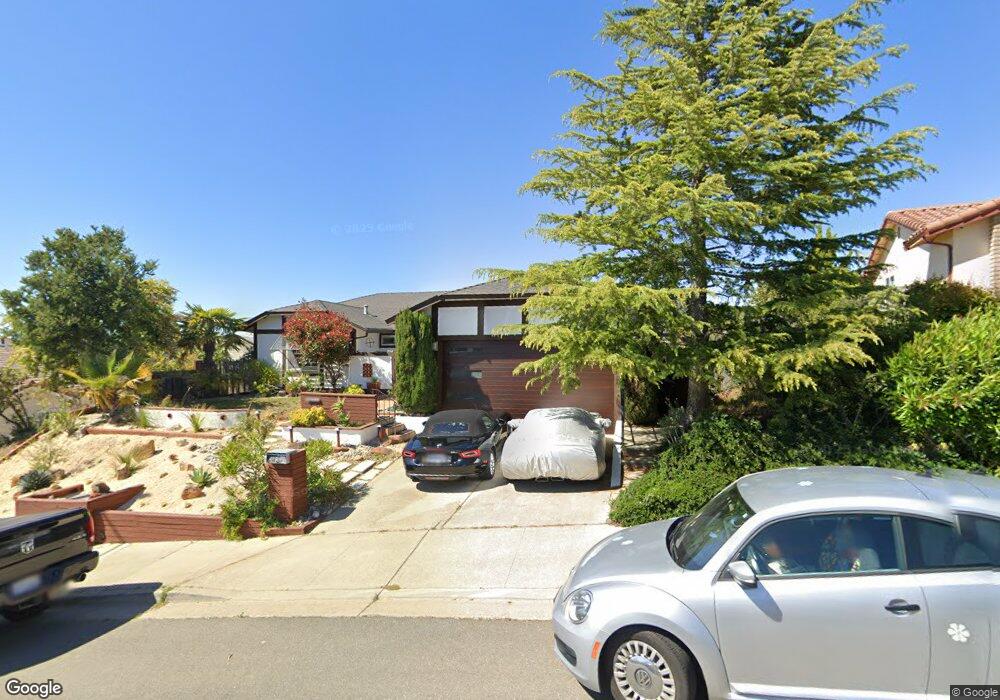
27096 Belfast Ln Hayward, CA 94542
Hayward Highland NeighborhoodEstimated Value: $1,150,000 - $1,372,000
3
Beds
2
Baths
1,683
Sq Ft
$734/Sq Ft
Est. Value
About This Home
This home is located at 27096 Belfast Ln, Hayward, CA 94542 and is currently estimated at $1,235,656, approximately $734 per square foot. 27096 Belfast Ln is a home located in Alameda County with nearby schools including Stonebrae Elementary School, Bret Harte Middle School, and Hayward High School.
Ownership History
Date
Name
Owned For
Owner Type
Purchase Details
Closed on
May 13, 2024
Sold by
Cole Richard S and Cole Melinda S
Bought by
Rick And Mindy Cole Trust and Cole
Current Estimated Value
Purchase Details
Closed on
Sep 18, 2002
Sold by
Kinsey Gerald J and Kinsey Eleanor A
Bought by
Cole Richard S and Cole Melinda S
Home Financials for this Owner
Home Financials are based on the most recent Mortgage that was taken out on this home.
Original Mortgage
$74,000
Interest Rate
5.99%
Purchase Details
Closed on
Apr 1, 2000
Sold by
Kinsey Eleanor A
Bought by
Kinsey Gerald J and Kinsey Eleanor A
Purchase Details
Closed on
Oct 12, 1998
Sold by
Shaw James and Shaw Anne
Bought by
Kinsey Eleanor A
Home Financials for this Owner
Home Financials are based on the most recent Mortgage that was taken out on this home.
Original Mortgage
$244,000
Interest Rate
6.79%
Purchase Details
Closed on
Sep 24, 1993
Sold by
Shaw James K and Shaw Anne L
Bought by
Shaw James and Shaw Anne
Create a Home Valuation Report for This Property
The Home Valuation Report is an in-depth analysis detailing your home's value as well as a comparison with similar homes in the area
Home Values in the Area
Average Home Value in this Area
Purchase History
| Date | Buyer | Sale Price | Title Company |
|---|---|---|---|
| Rick And Mindy Cole Trust | -- | None Listed On Document | |
| Cole Richard S | $495,000 | Chicago Title Company | |
| Kinsey Gerald J | -- | -- | |
| Kinsey Eleanor A | $305,000 | North American Title Co | |
| Kinsey Eleanor A | -- | North American Title Co | |
| Shaw James | -- | -- |
Source: Public Records
Mortgage History
| Date | Status | Borrower | Loan Amount |
|---|---|---|---|
| Previous Owner | Cole Richard S | $74,000 | |
| Previous Owner | Kinsey Eleanor A | $244,000 |
Source: Public Records
Tax History Compared to Growth
Tax History
| Year | Tax Paid | Tax Assessment Tax Assessment Total Assessment is a certain percentage of the fair market value that is determined by local assessors to be the total taxable value of land and additions on the property. | Land | Improvement |
|---|---|---|---|---|
| 2025 | $8,854 | $730,133 | $215,057 | $522,076 |
| 2024 | $8,854 | $715,682 | $210,841 | $511,841 |
| 2023 | $8,720 | $708,517 | $206,709 | $501,808 |
| 2022 | $8,549 | $687,626 | $202,656 | $491,970 |
| 2021 | $8,478 | $674,011 | $198,684 | $482,327 |
| 2020 | $8,383 | $674,032 | $196,648 | $477,384 |
| 2019 | $8,451 | $660,819 | $192,793 | $468,026 |
| 2018 | $7,923 | $647,864 | $189,013 | $458,851 |
| 2017 | $7,737 | $635,165 | $185,308 | $449,857 |
| 2016 | $7,303 | $622,715 | $181,676 | $441,039 |
| 2015 | $7,154 | $613,364 | $178,948 | $434,416 |
| 2014 | $6,788 | $601,352 | $175,443 | $425,909 |
Source: Public Records
Map
Nearby Homes
- 0 Hayward Blvd Unit 41103610
- 0 Parkside Dr
- 27030 Parkside Dr
- 3274 Red Leaf Ct
- 27896 Adobe Ct
- 2743 Gamble Ct
- 27050 Vista Bahia Way
- 0 Chronicle Ave Unit 41091503
- 2485 Saint Helena Dr Unit 3
- 2437 Saint Helena Dr Unit 3
- 2419 Saint Helena Dr Unit 6
- 3446 Eureka Ct
- 25912 Hayward Blvd Unit 106
- 2151 Brandywine Place
- 2108 Thistle Ct
- 3375 East Ave
- 3981 Amyx Ct
- 0 Fairview Unit 41108563
- 2833 Colony View Place
- 3246 Saddle Dr
- 27092 Belfast Ln
- 27104 Belfast Ln
- 27095 Belfast Ln
- 27088 Belfast Ln
- 27112 Belfast Ln
- 27087 Belfast Ln
- 27103 Belfast Ln
- 27124 Belfast Ln
- 27188 Hayward Blvd
- 9999 Hayward Blvd
- 99999 Hayward Blvd
- 28288 Hayward Blvd
- 0000 Hayward Blvd
- 27080 Belfast Ln
- 27079 Belfast Ln
- 27121 Belfast Ln
- 0 Hayward Blvd Unit 40804166
- 0 Hayward Blvd Unit 40801673
- 0 Hayward Blvd Unit 40321763
- 0 Hayward Blvd Unit 40334247