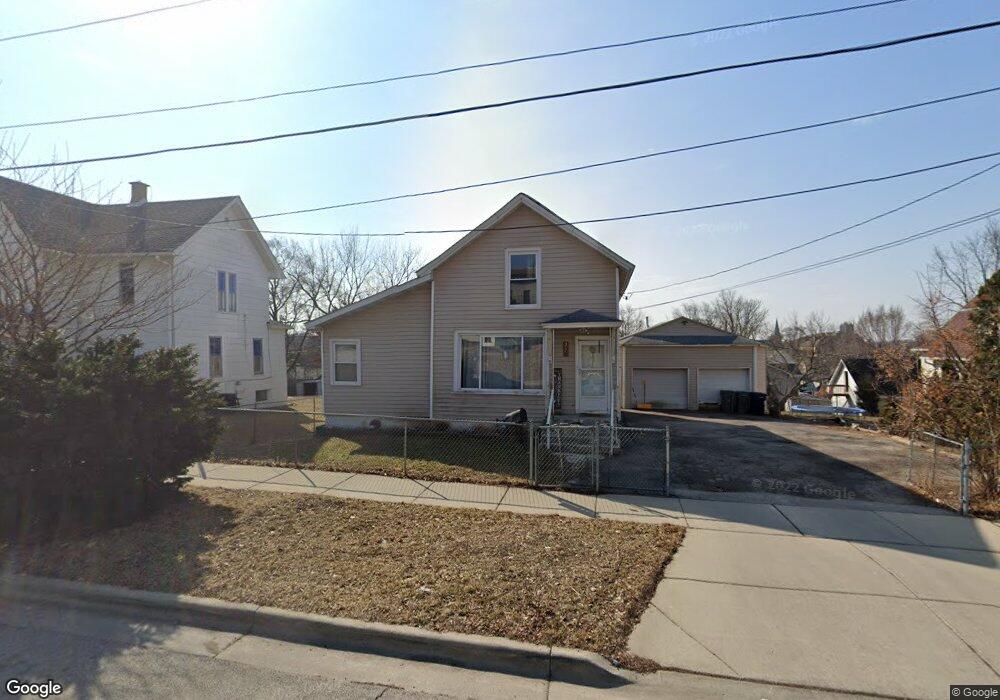
271 Cherry St Elgin, IL 60120
Northeast Elgin NeighborhoodEstimated Value: $250,000 - $282,916
4
Beds
2
Baths
1,248
Sq Ft
$216/Sq Ft
Est. Value
About This Home
This home is located at 271 Cherry St, Elgin, IL 60120 and is currently estimated at $269,979, approximately $216 per square foot. 271 Cherry St is a home located in Kane County with nearby schools including Ronald D O'Neal Elementary School, Kimball Middle School, and Larkin High School.
Ownership History
Date
Name
Owned For
Owner Type
Purchase Details
Closed on
Feb 15, 2000
Sold by
Silva Roberto S and Silva Rosalba
Bought by
Rodriguez Niko and Mendez Neftali
Current Estimated Value
Home Financials for this Owner
Home Financials are based on the most recent Mortgage that was taken out on this home.
Original Mortgage
$117,250
Outstanding Balance
$38,901
Interest Rate
8.21%
Mortgage Type
FHA
Estimated Equity
$231,078
Create a Home Valuation Report for This Property
The Home Valuation Report is an in-depth analysis detailing your home's value as well as a comparison with similar homes in the area
Home Values in the Area
Average Home Value in this Area
Purchase History
| Date | Buyer | Sale Price | Title Company |
|---|---|---|---|
| Rodriguez Niko | $117,500 | -- |
Source: Public Records
Mortgage History
| Date | Status | Borrower | Loan Amount |
|---|---|---|---|
| Open | Rodriguez Niko | $117,250 |
Source: Public Records
Tax History
| Year | Tax Paid | Tax Assessment Tax Assessment Total Assessment is a certain percentage of the fair market value that is determined by local assessors to be the total taxable value of land and additions on the property. | Land | Improvement |
|---|---|---|---|---|
| 2024 | $5,775 | $72,168 | $12,915 | $59,253 |
| 2023 | $5,558 | $65,199 | $11,668 | $53,531 |
| 2022 | $5,155 | $59,450 | $10,639 | $48,811 |
| 2021 | $4,959 | $55,582 | $9,947 | $45,635 |
| 2020 | $4,839 | $53,062 | $9,496 | $43,566 |
| 2019 | $4,721 | $50,545 | $9,046 | $41,499 |
| 2018 | $4,248 | $42,970 | $8,522 | $34,448 |
| 2017 | $4,178 | $40,622 | $8,056 | $32,566 |
| 2016 | $4,019 | $37,686 | $7,474 | $30,212 |
| 2015 | -- | $34,543 | $6,851 | $27,692 |
| 2014 | -- | $34,116 | $6,766 | $27,350 |
| 2013 | -- | $39,969 | $6,944 | $33,025 |
Source: Public Records
Map
Nearby Homes
- 464 Prospect St
- 363 Franklin Blvd
- 268 N Gifford St
- 603 Douglas Ave
- 131 N Gifford St
- 409 Algona Ave
- 453 Addison St
- 58 S Geneva St
- 841 Douglas Ave
- 216 Prairie St
- 851 N Grove Ave
- 115 N Porter St
- 920 Augusta Ave
- 211 Prairie St
- 162 Festival Ct
- 601 Columbia Ave
- 9 N Jackson St
- 643 Wing St
- 96 S Crystal St
- 277 Gifford Place
Your Personal Tour Guide
Ask me questions while you tour the home.