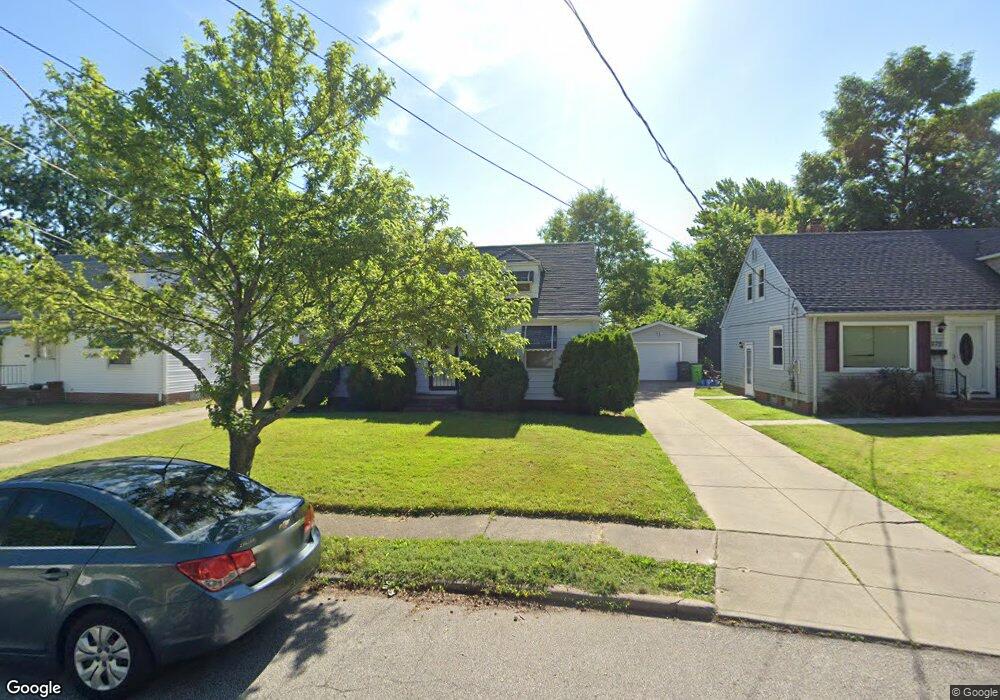
271 E 242nd St Euclid, OH 44123
Estimated Value: $145,677 - $151,000
4
Beds
2
Baths
1,302
Sq Ft
$114/Sq Ft
Est. Value
About This Home
This home is located at 271 E 242nd St, Euclid, OH 44123 and is currently estimated at $147,919, approximately $113 per square foot. 271 E 242nd St is a home located in Cuyahoga County with nearby schools including Shoreview Elementary School, Euclid High School, and Our Lady Of The Lake School.
Ownership History
Date
Name
Owned For
Owner Type
Purchase Details
Closed on
Jul 23, 2003
Sold by
Parker Era Juanita
Bought by
Robinson Gwyneta and Howard Michael E
Current Estimated Value
Home Financials for this Owner
Home Financials are based on the most recent Mortgage that was taken out on this home.
Original Mortgage
$104,900
Outstanding Balance
$42,791
Interest Rate
5.3%
Mortgage Type
Purchase Money Mortgage
Estimated Equity
$105,128
Purchase Details
Closed on
May 14, 1996
Sold by
Trst John Battung
Bought by
Lisa Wiley & Era J Parker
Home Financials for this Owner
Home Financials are based on the most recent Mortgage that was taken out on this home.
Original Mortgage
$76,687
Interest Rate
7.78%
Mortgage Type
FHA
Purchase Details
Closed on
Aug 15, 1975
Sold by
Battung Hilda M
Bought by
Battung John A and Battung Hilda M
Purchase Details
Closed on
Jan 1, 1975
Bought by
Battung Hilda M
Create a Home Valuation Report for This Property
The Home Valuation Report is an in-depth analysis detailing your home's value as well as a comparison with similar homes in the area
Home Values in the Area
Average Home Value in this Area
Purchase History
| Date | Buyer | Sale Price | Title Company |
|---|---|---|---|
| Robinson Gwyneta | $104,900 | Multiple | |
| Lisa Wiley & Era J Parker | $76,900 | -- | |
| Battung John A | -- | -- | |
| Battung Hilda M | -- | -- |
Source: Public Records
Mortgage History
| Date | Status | Borrower | Loan Amount |
|---|---|---|---|
| Open | Robinson Gwyneta | $104,900 | |
| Previous Owner | Lisa Wiley & Era J Parker | $76,687 |
Source: Public Records
Tax History
| Year | Tax Paid | Tax Assessment Tax Assessment Total Assessment is a certain percentage of the fair market value that is determined by local assessors to be the total taxable value of land and additions on the property. | Land | Improvement |
|---|---|---|---|---|
| 2025 | $3,078 | $46,130 | $7,805 | $38,325 |
| 2024 | $3,172 | $46,130 | $7,805 | $38,325 |
| 2023 | $2,559 | $29,400 | $5,670 | $23,730 |
| 2022 | $2,501 | $29,400 | $5,670 | $23,730 |
| 2021 | $2,788 | $29,400 | $5,670 | $23,730 |
| 2020 | $2,828 | $27,230 | $5,250 | $21,980 |
| 2019 | $2,542 | $77,800 | $15,000 | $62,800 |
| 2018 | $2,567 | $27,230 | $5,250 | $21,980 |
| 2017 | $2,747 | $24,370 | $4,240 | $20,130 |
| 2016 | $2,753 | $24,370 | $4,240 | $20,130 |
| 2015 | $2,506 | $24,370 | $4,240 | $20,130 |
| 2014 | $2,506 | $24,370 | $4,240 | $20,130 |
Source: Public Records
Map
Nearby Homes
- 325 E 244th St
- 344 E 246th St
- 295 E 238th St
- 271 E 238th St
- 328 E 238th St
- 24891 Zeman Ave
- 323 E 235th St
- 24791 Drakefield Ave
- 464 E 250th St
- 101 E 238th St
- 110 E 238th St
- 324 E 235th St
- 25151 Zeman Ave
- 71 Lake Edge Dr
- 515 E 250th St
- 25401 Farringdon Ave
- 25370 Drakefield Ave
- 25731 Zeman Ave
- 25671 Farringdon Ave
- 25591 Forestview Ave
- 275 E 242nd St
- 265 E 242nd St
- 336 E 243rd St
- 261 E 242nd St
- 24233 Maplewood Ave
- 24346 Paradise Ln
- 276 E 242nd St
- 24203 Maplewood Ave
- 24251 Maplewood Ave
- 270 E 242nd St
- 255 E 242nd St
- 24171 Maplewood Ave
- 266 E 242nd St
- 24273 Maplewood Ave
- 330 E 243rd St
- 311 E 241st St
- 24331 Maplewood Ave
- 264 E 242nd St
- 251 E 242nd St
- 324 E 243rd St
Your Personal Tour Guide
Ask me questions while you tour the home.