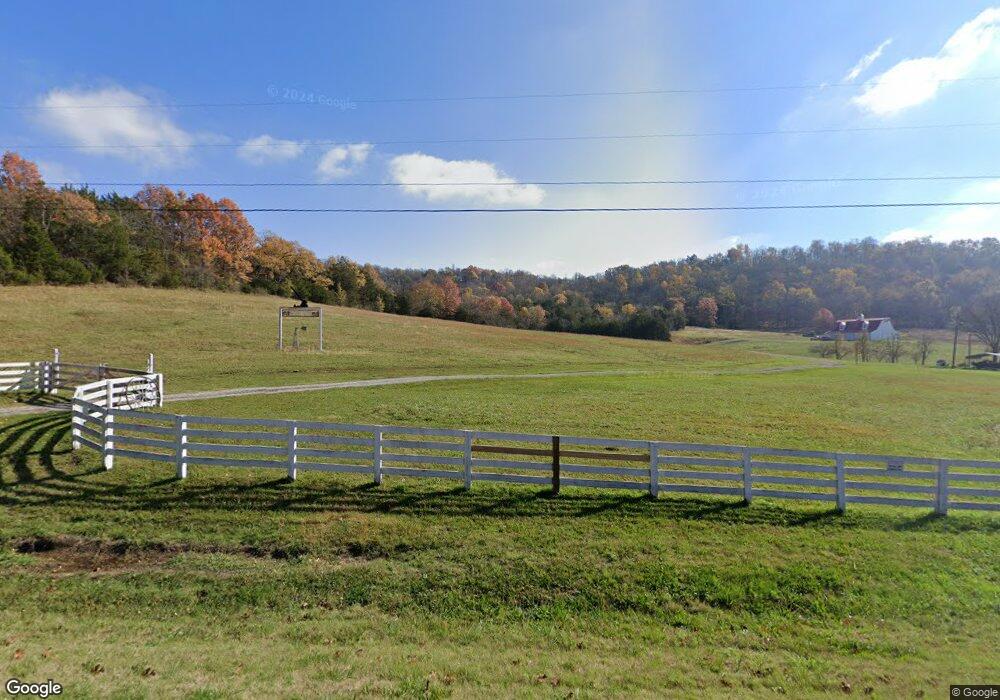
271 Gingerbread Rd Petersburg, TN 37144
Estimated Value: $271,000 - $1,340,838
--
Bed
1
Bath
1,379
Sq Ft
$584/Sq Ft
Est. Value
About This Home
This home is located at 271 Gingerbread Rd, Petersburg, TN 37144 and is currently estimated at $805,919, approximately $584 per square foot. 271 Gingerbread Rd is a home located in Lincoln County with nearby schools including Unity School, Lincoln Central Academy, and Lincoln County High School.
Ownership History
Date
Name
Owned For
Owner Type
Purchase Details
Closed on
Sep 27, 2019
Sold by
Meadows Gloria G and Gill William W
Bought by
Blocker Cecil R
Current Estimated Value
Home Financials for this Owner
Home Financials are based on the most recent Mortgage that was taken out on this home.
Original Mortgage
$206,400
Outstanding Balance
$137,951
Interest Rate
3.6%
Mortgage Type
Commercial
Estimated Equity
$667,968
Purchase Details
Closed on
Jun 3, 2002
Sold by
Harp William J and Harp Sarah F
Bought by
Blocker Cecil R
Purchase Details
Closed on
Dec 8, 1998
Sold by
Harp William J
Bought by
Harp Sarah F
Purchase Details
Closed on
Jan 21, 1991
Bought by
Blocker Cecil R
Purchase Details
Closed on
Oct 6, 1967
Create a Home Valuation Report for This Property
The Home Valuation Report is an in-depth analysis detailing your home's value as well as a comparison with similar homes in the area
Home Values in the Area
Average Home Value in this Area
Purchase History
| Date | Buyer | Sale Price | Title Company |
|---|---|---|---|
| Blocker Cecil R | $200,000 | None Available | |
| Blocker Cecil R | $200,000 | None Available | |
| Blocker Cecil R | $126,500 | -- | |
| Blocker Cecil R | $126,500 | -- | |
| Harp Sarah F | -- | -- | |
| Harp Sarah F | -- | -- | |
| Blocker Cecil R | $85,000 | -- | |
| Blocker Cecil R | $85,000 | -- | |
| -- | -- | -- | |
| -- | -- | -- |
Source: Public Records
Mortgage History
| Date | Status | Borrower | Loan Amount |
|---|---|---|---|
| Open | Blocker Cecil R | $206,400 | |
| Closed | Blocker Cecil R | $206,400 |
Source: Public Records
Tax History Compared to Growth
Tax History
| Year | Tax Paid | Tax Assessment Tax Assessment Total Assessment is a certain percentage of the fair market value that is determined by local assessors to be the total taxable value of land and additions on the property. | Land | Improvement |
|---|---|---|---|---|
| 2024 | $3,047 | $160,375 | $67,175 | $93,200 |
| 2023 | $3,134 | $108,750 | $46,900 | $61,850 |
| 2022 | $2,286 | $108,750 | $46,900 | $61,850 |
| 2021 | $2,286 | $108,750 | $46,900 | $61,850 |
| 2020 | $1,678 | $108,750 | $46,900 | $61,850 |
| 2019 | $1,362 | $79,825 | $40,750 | $39,075 |
| 2018 | $1,257 | $50,675 | $19,275 | $31,400 |
| 2017 | $1,186 | $50,675 | $19,275 | $31,400 |
| 2016 | $1,186 | $50,675 | $19,275 | $31,400 |
| 2015 | -- | $50,675 | $19,275 | $31,400 |
| 2014 | $993 | $50,675 | $19,275 | $31,400 |
Source: Public Records
Map
Nearby Homes
- 0 Petersburg Chesnut Ridge Rd
- 114 Hill St
- 412 College St
- 401 College St
- 304 Russell St
- 0 Highway 130 W
- 307 Railroad St
- 0 Shelbyville Hwy Unit 24069432
- 0 Shelbyville Hwy Unit RTC2929997
- 0 Shelbyville Hwy Unit RTC2835325
- 854 Shelbyville Hwy
- 3000 Toll Gate Rd
- 8 N Fishing Ford Rd
- 171 S Fishing Ford Rd
- 856 Petersburg Chestnt Rdg Rd
- 911 Petersburg Chestnt Rdg Rd
- 0 Hannah Br Rd Unit RTC2993363
- 0 Twin Springs Rd
- 0 Poor Grab Rd
- 0 Fayetteville Hwy Unit RTC2993836