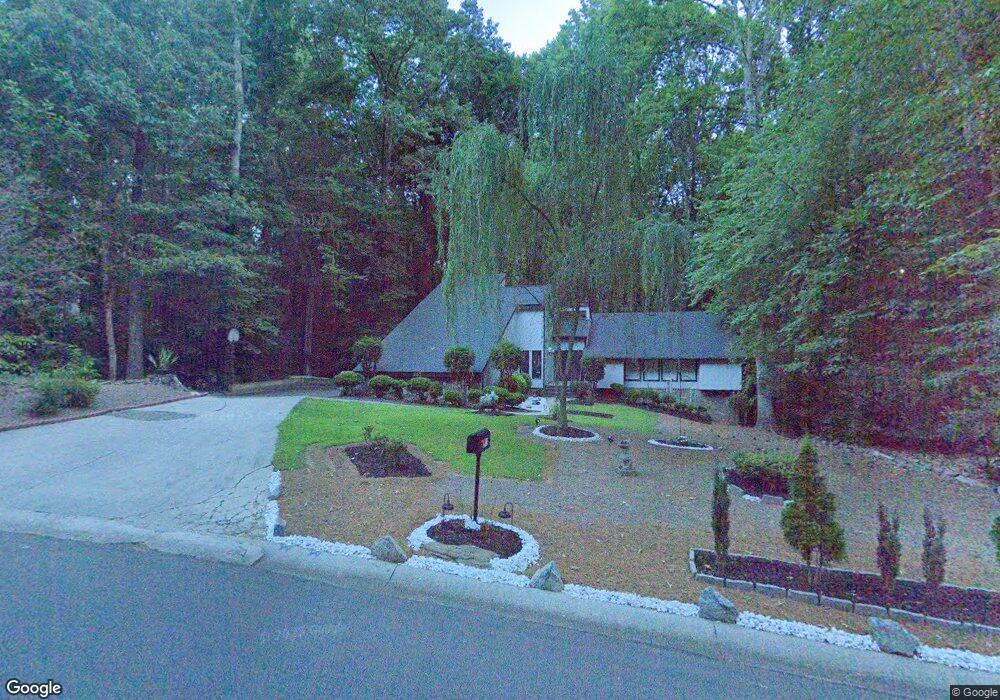
271 Hunting Creek Dr Unit 4 Marietta, GA 30068
Estimated Value: $461,524 - $558,000
5
Beds
3
Baths
2,000
Sq Ft
$251/Sq Ft
Est. Value
About This Home
This home is located at 271 Hunting Creek Dr Unit 4, Marietta, GA 30068 and is currently estimated at $502,631, approximately $251 per square foot. 271 Hunting Creek Dr Unit 4 is a home located in Cobb County with nearby schools including Sedalia Park Elementary School, East Cobb Middle School, and Wheeler High School.
Ownership History
Date
Name
Owned For
Owner Type
Purchase Details
Closed on
Mar 20, 2020
Sold by
Abbasi Behnam
Bought by
Sharti Mobarak Behnaz
Current Estimated Value
Home Financials for this Owner
Home Financials are based on the most recent Mortgage that was taken out on this home.
Original Mortgage
$160,000
Outstanding Balance
$141,433
Interest Rate
3.4%
Mortgage Type
New Conventional
Estimated Equity
$361,198
Purchase Details
Closed on
May 21, 2018
Sold by
Abbasi Behnam
Bought by
Abbasi Behnam and Sharifi Mobarak Behnaz
Purchase Details
Closed on
May 21, 2013
Sold by
Winters Joan
Bought by
Abbasi Behnam
Home Financials for this Owner
Home Financials are based on the most recent Mortgage that was taken out on this home.
Original Mortgage
$180,000
Interest Rate
3.43%
Mortgage Type
New Conventional
Purchase Details
Closed on
Mar 24, 1995
Sold by
Obrien Patrick V Carol
Bought by
Winters John and Davis Eric R
Create a Home Valuation Report for This Property
The Home Valuation Report is an in-depth analysis detailing your home's value as well as a comparison with similar homes in the area
Home Values in the Area
Average Home Value in this Area
Purchase History
| Date | Buyer | Sale Price | Title Company |
|---|---|---|---|
| Sharti Mobarak Behnaz | -- | None Available | |
| Abbasi Behnam | -- | -- | |
| Abbasi Behnam | $200,000 | -- | |
| Winters John | $159,000 | -- |
Source: Public Records
Mortgage History
| Date | Status | Borrower | Loan Amount |
|---|---|---|---|
| Open | Sharti Mobarak Behnaz | $160,000 | |
| Previous Owner | Abbasi Behnam | $180,000 |
Source: Public Records
Tax History Compared to Growth
Tax History
| Year | Tax Paid | Tax Assessment Tax Assessment Total Assessment is a certain percentage of the fair market value that is determined by local assessors to be the total taxable value of land and additions on the property. | Land | Improvement |
|---|---|---|---|---|
| 2024 | $4,183 | $173,576 | $56,000 | $117,576 |
| 2023 | $2,882 | $138,640 | $44,000 | $94,640 |
| 2022 | $3,404 | $136,492 | $44,000 | $92,492 |
| 2021 | $3,271 | $130,420 | $44,000 | $86,420 |
| 2020 | $3,271 | $130,420 | $44,000 | $86,420 |
| 2019 | $3,271 | $130,420 | $44,000 | $86,420 |
| 2018 | $2,590 | $99,312 | $30,000 | $69,312 |
| 2017 | $2,478 | $99,312 | $30,000 | $69,312 |
| 2016 | $2,343 | $81,488 | $30,000 | $51,488 |
| 2015 | $2,401 | $81,488 | $30,000 | $51,488 |
| 2014 | $2,377 | $80,000 | $0 | $0 |
Source: Public Records
Map
Nearby Homes
- 201 Hunting Creek Dr
- 361 Clear Spring Ct
- 57 Sewell Ln
- 310 Clear Spring Ct
- 478 Guilford Cir
- 332 Hamilton Trace
- 1821 Clearwater Dr SE
- 507 Spring Creek Way NE Unit 2
- 53 Weatherstone Pkwy
- 2377 Emory Ln NE
- 20 Ashton Woods Dr
- 2164 Pawnee Dr SE Unit 1
- 583 Spring Creek Way NE
- 2431 Weatherford Ct
- 2310 Old Sewell Rd
- 190 Kenley Ct
- 349 Virginia Place SE
- 402 Terrydale Dr SE
- 2059 Clearwater Dr SE
- 271 Hunting Creek Dr
- 267 Hunting Creek Dr Unit 4
- 275 Hunting Creek Dr
- 259 Hunting Creek Dr
- 266 Hunting Creek Dr
- 279 Hunting Creek Dr
- 258 Hunting Creek Dr
- 251 Hunting Creek Dr
- 283 Hunting Creek Dr Unit 4
- 250 Hunting Creek Dr
- 236 Indian Trail
- 226 Indian Trail
- 226 Indian Trail Unit 1
- 206 Indian Trail
- 271 Weatherstone Pkwy
- 246 Indian Trail
- 287 Hunting Creek Dr
- 196 Indian Trail
- 265 Weatherstone Pkwy
- 243 Hunting Creek Dr