
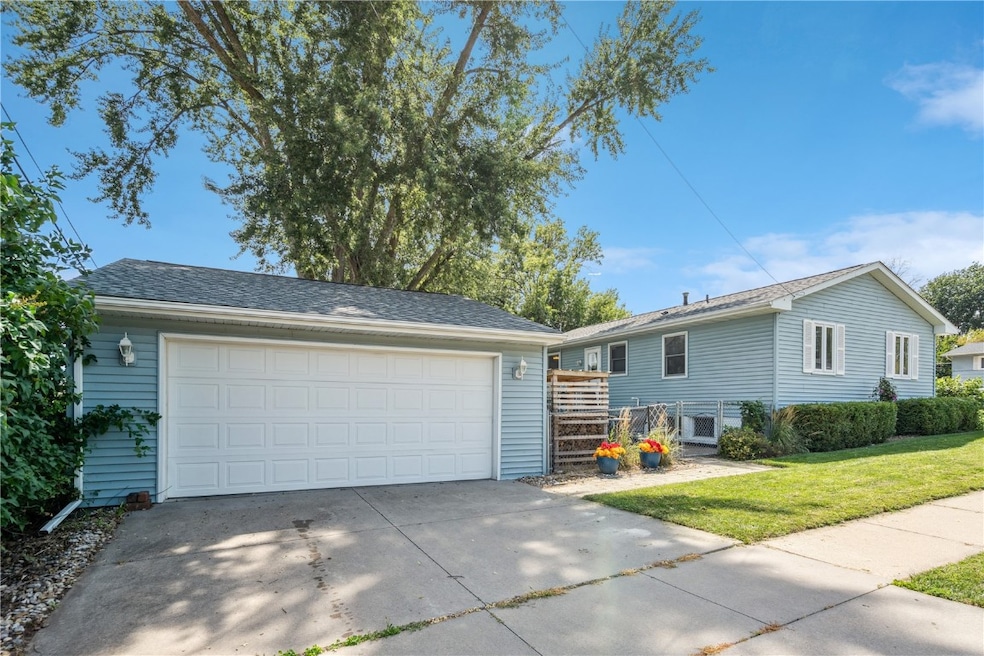


271 Lynda Dr NW Cedar Rapids, IA 52405
Cherry Hill Park NeighborhoodEstimated payment $1,378/month
Total Views
13,909
3
Beds
1.5
Baths
1,630
Sq Ft
$126
Price per Sq Ft
Highlights
- No HOA
- Patio
- 2 Car Garage
- Eat-In Kitchen
- Forced Air Heating and Cooling System
- Fenced
About This Home
Charming and well maintained 3-bedroom 1.5 bath ranch offering comfort and convenience in every detail. This inviting home features a bright airy layout and thoughtful updates throughout. Enjoy a spacious living area, functional kitchen and three comfortable bedrooms perfect for family or guests.
Outside, a fully fenced backyard provides privacy and security, complete with a patio ideal for outdoor entertaining or relaxing summer evenings. The property also includes a two-stall detached garage with a heater offering ample storage and workspace year round.
Move-in ready and meticulously cared for, this home blends style, functionality and a great location, ready for its next chapter.
Home Details
Home Type
- Single Family
Est. Annual Taxes
- $3,152
Year Built
- Built in 1967
Lot Details
- 6,970 Sq Ft Lot
- Fenced
Parking
- 2 Car Garage
- Garage Door Opener
Home Design
- Block Foundation
- Frame Construction
- Vinyl Siding
Interior Spaces
- 1-Story Property
- Basement
Kitchen
- Eat-In Kitchen
- Range
- Microwave
- Dishwasher
Bedrooms and Bathrooms
- 3 Bedrooms
Laundry
- Dryer
- Washer
Schools
- Hoover Elementary School
- Roosevelt Middle School
- Jefferson High School
Additional Features
- Patio
- Forced Air Heating and Cooling System
Community Details
- No Home Owners Association
Listing and Financial Details
- Assessor Parcel Number 132528000200000
Map
Create a Home Valuation Report for This Property
The Home Valuation Report is an in-depth analysis detailing your home's value as well as a comparison with similar homes in the area
Home Values in the Area
Average Home Value in this Area
Tax History
| Year | Tax Paid | Tax Assessment Tax Assessment Total Assessment is a certain percentage of the fair market value that is determined by local assessors to be the total taxable value of land and additions on the property. | Land | Improvement |
|---|---|---|---|---|
| 2024 | $3,326 | $194,700 | $38,500 | $156,200 |
| 2023 | $3,326 | $178,100 | $33,300 | $144,800 |
| 2022 | $3,180 | $157,700 | $33,300 | $124,400 |
| 2021 | $3,086 | $153,500 | $29,800 | $123,700 |
| 2020 | $3,086 | $139,900 | $24,500 | $115,400 |
| 2019 | $2,990 | $138,700 | $24,500 | $114,200 |
| 2018 | $2,908 | $138,700 | $24,500 | $114,200 |
| 2017 | $2,735 | $132,000 | $24,500 | $107,500 |
| 2016 | $2,735 | $128,700 | $24,500 | $104,200 |
| 2015 | $2,550 | $131,859 | $24,500 | $107,359 |
| 2014 | $2,620 | $131,859 | $24,500 | $107,359 |
| 2013 | $2,560 | $131,859 | $24,500 | $107,359 |
Source: Public Records
Property History
| Date | Event | Price | Change | Sq Ft Price |
|---|---|---|---|---|
| 08/28/2025 08/28/25 | Price Changed | $204,900 | -4.7% | $126 / Sq Ft |
| 08/09/2025 08/09/25 | For Sale | $214,900 | -- | $132 / Sq Ft |
Source: Cedar Rapids Area Association of REALTORS®
Purchase History
| Date | Type | Sale Price | Title Company |
|---|---|---|---|
| Warranty Deed | -- | None Available | |
| Warranty Deed | $135,000 | None Available | |
| Special Warranty Deed | $121,500 | -- | |
| Warranty Deed | $121,500 | -- |
Source: Public Records
Mortgage History
| Date | Status | Loan Amount | Loan Type |
|---|---|---|---|
| Previous Owner | $121,000 | New Conventional | |
| Previous Owner | $128,725 | Purchase Money Mortgage | |
| Previous Owner | $24,000 | Unknown | |
| Previous Owner | $94,800 | Unknown | |
| Closed | $18,262 | No Value Available |
Source: Public Records
Similar Homes in Cedar Rapids, IA
-
$165,000
- 4 Beds
- 2 Baths
- 1,798 Sq Ft
- 1238 Ellis Blvd NW
- Cedar Rapids, IA
This charming two-story home boasts a fantastic location and has many recent updates. With ample space for entertaining, you can enjoy your gatherings in the spacious main floor living room and the back entertainment room. The home features two bedrooms on the main floor and two additional bedrooms on the upper floor. There is a full bathroom on each level for added convenience. Recent upgrades
Matthew Lepic Lepic-Kroeger, REALTORS
-
$159,900
- 3 Beds
- 2 Baths
- 1,598 Sq Ft
- 383 21st St SE
- Cedar Rapids, IA
Imagine yourself living in a charming home that's been around since 1909, with a rich history and character that's just waiting to be loved. As you walk in, you'll be greeted by the beautiful open stairway and stunning oak floors that set the tone for a warm and inviting atmosphere. This amazing 3 bedroom, 2 bathroom home has so much to offer, from the cozy wood-burning fireplace that's perfect
Cat Brown Move In-Out Real Estate
Source: Cedar Rapids Area Association of REALTORS®
MLS Number: 2506829
APN: 13252-80002-00000
Disclaimer: Certain information contained herein is derived from information provided by parties other than Homes.com. All information provided is deemed reliable, but is not guaranteed to be accurate and should be independently verified.
![]() IDX information is provided exclusively for personal, non-commercial use, and may not be used for any purpose other than to identify prospective properties consumers may be interested in purchasing.
IDX information is provided exclusively for personal, non-commercial use, and may not be used for any purpose other than to identify prospective properties consumers may be interested in purchasing.
Information is deemed reliable but not guaranteed.
Nearby Homes
- 4541 Midway Dr NW
- 4701 Midway Dr NW
- 446 Bezdek Dr NW
- 4821 Midway Dr NW
- 4325 Orchard Dr NW
- 281 Jacolyn Dr NW
- 740 Wiley Blvd NW
- 123 Rich Mar Ct NW
- 4309 Woodsonia Ct NW
- 68 Julia Ann Dr NW
- 5101 Kesler Rd NW
- 4807 Montclair Dr NW
- 1004 1st Ave NW
- 4812 Montclair Dr NW
- 3515 E Ave NW Unit D
- 5111 E Ave NW
- 3511 E Ave NW Unit D
- 4619 1st Ave SW Unit 3
- 129 Heath St NW
- 3400 Sue Ln NW
- 117-129 Harbet Ave NW
- 4419 1st Ave SW
- 110 Jacolyn Dr SW
- 4900 16th Ave SW
- 5150 16th Ave SW
- 5200 16th Ave SW
- 3200-3201 G Ave NW
- 1270 Edgewood Rd NW
- 321 28th St NW
- 4227 21st Ave SW
- 470 Quail Ct SW
- 2155 Westdale Dr SW
- 5840 & 5850 Lockwood Dr SW
- 1601 30th St NW
- 3101 Samuel Ct SW Unit 5
- 2141 29th St NW
- 3205 Samuel Ct SW
- 2202-2238 River Bluffs Dr
- 2415 River Bluff Dr NW
- 3320 Queen Dr