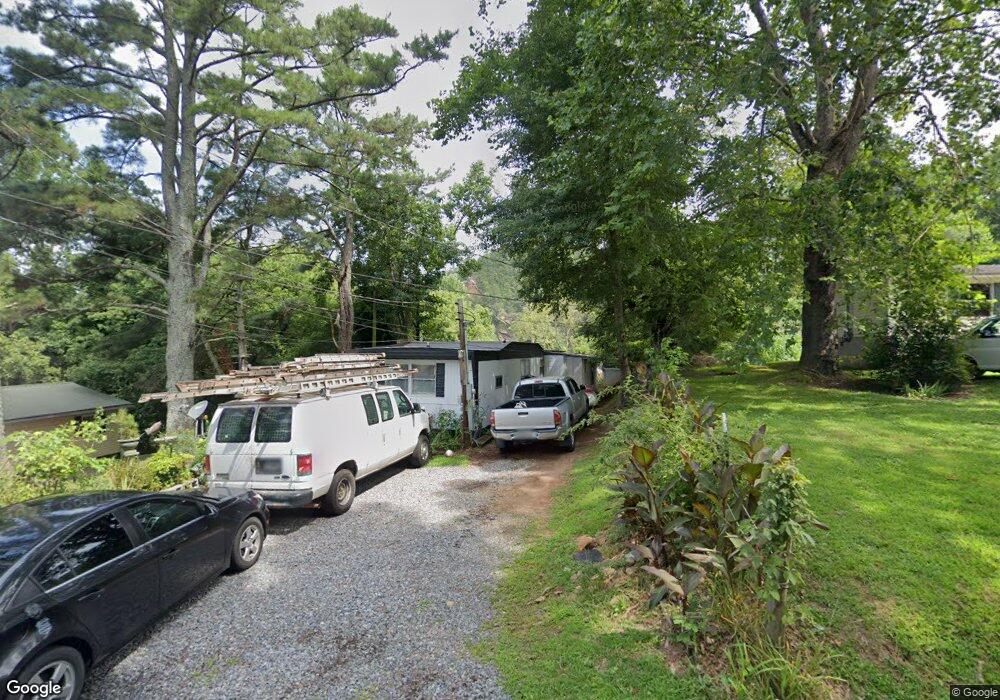
271 Mulberry St East Ellijay, GA 30540
Estimated Value: $354,200 - $386,000
3
Beds
2
Baths
1,414
Sq Ft
$261/Sq Ft
Est. Value
About This Home
This home is located at 271 Mulberry St, East Ellijay, GA 30540 and is currently estimated at $369,550, approximately $261 per square foot. 271 Mulberry St is a home located in Gilmer County with nearby schools including Ellijay Elementary School, Clear Creek Elementary School, and Gilmer Middle School.
Ownership History
Date
Name
Owned For
Owner Type
Purchase Details
Closed on
Dec 10, 2024
Sold by
Lerma Jose Alfredo
Bought by
Rocha Jose A Lerma
Current Estimated Value
Purchase Details
Closed on
Oct 13, 2018
Sold by
Orihuela Elia
Bought by
Lerma Jose Alfredo
Purchase Details
Closed on
Jan 14, 2011
Sold by
Lerma Jose Alfredo
Bought by
Orihuela Elia
Purchase Details
Closed on
Jan 13, 2011
Sold by
Selene Finance Lp
Bought by
Lerma Jose Alfredo
Purchase Details
Closed on
Aug 3, 2010
Sold by
Parks Randy
Bought by
Selene Finance Lp As Servicer For Taylor
Purchase Details
Closed on
Nov 26, 2008
Sold by
Wood Mike
Bought by
Parks Rany
Purchase Details
Closed on
Jan 21, 2004
Sold by
Grizzle Alice and Godfrey Ricky
Bought by
Parks Randy and Wood Sr, Mike
Purchase Details
Closed on
Jun 1, 1992
Bought by
Grizzle Alice
Create a Home Valuation Report for This Property
The Home Valuation Report is an in-depth analysis detailing your home's value as well as a comparison with similar homes in the area
Home Values in the Area
Average Home Value in this Area
Purchase History
| Date | Buyer | Sale Price | Title Company |
|---|---|---|---|
| Rocha Jose A Lerma | -- | -- | |
| R & R Properties Llp | -- | -- | |
| Lerma Jose Alfredo | -- | -- | |
| Orihuela Elia | -- | -- | |
| Lerma Jose Alfredo | $18,000 | -- | |
| Selene Finance Lp As Servicer For Taylor | $41,200 | -- | |
| Selene Finance Lp | $41,225 | -- | |
| Parks Rany | -- | -- | |
| Parks Randy | $17,000 | -- | |
| Grizzle Alice | -- | -- |
Source: Public Records
Tax History Compared to Growth
Tax History
| Year | Tax Paid | Tax Assessment Tax Assessment Total Assessment is a certain percentage of the fair market value that is determined by local assessors to be the total taxable value of land and additions on the property. | Land | Improvement |
|---|---|---|---|---|
| 2024 | $2,108 | $136,028 | $10,000 | $126,028 |
| 2023 | $2,128 | $133,068 | $11,400 | $121,668 |
| 2022 | $1,922 | $109,188 | $11,400 | $97,788 |
| 2021 | $1,657 | $83,496 | $8,600 | $74,896 |
| 2020 | $1,320 | $60,012 | $4,200 | $55,812 |
| 2019 | $1,356 | $59,896 | $4,200 | $55,696 |
| 2018 | $1,374 | $59,896 | $4,200 | $55,696 |
| 2017 | $1,197 | $48,660 | $4,200 | $44,460 |
| 2016 | $1,222 | $48,664 | $4,200 | $44,464 |
| 2015 | $1,114 | $45,184 | $4,200 | $40,984 |
| 2014 | $424 | $16,540 | $4,200 | $12,340 |
| 2013 | -- | $16,660 | $4,200 | $12,460 |
Source: Public Records
Map
Nearby Homes
- 118 E Oak St
- 265 Jeff Dr
- 138.06 AC Georgia 515
- 31 Willow St
- 135 Hill St
- 0 Hill St
- 645 Riverside Dr
- 466 Hefner St
- 232 Andes Ridge
- 269 Old Orchard Rd
- 195 River St
- 71 Black Walnut Place
- 0 Walhalla Ct Unit 388 10559982
- 0 Walhalla Ct Unit 7611949
- 0 Walhalla Ct Unit 10419854
- 0 Walhalla Ct Unit 7491828
- 0 Walhalla Ct Unit 7491796
- 0 Walhalla Ct Unit 10419848
- 0 Walhalla Ct Unit Lot 387 8994062
- 138.06AC Georgia 515
- 263 Mulberry St
- 325 Mulberry St
- 252 Mulberry St
- 272 Mulberry St
- 200 Mulberry St
- 262 Mulberry St
- 170 Riverside Dr
- 0 Riveredge Dr Unit TRACT
- 0 Riveredge Dr Unit TRACT 7581629
- 75 Spring St
- 95 E Spring St
- 160 Mulberry St
- 160 Mulberry St Unit 160
- 145 Mulberry St
- 350 Mulberry St
- 1-48 Cold Springs Rd
- 174 E Spring St
- 176 Spring St
- 241 Mulberry St
- 83 Holly Ridge Ln