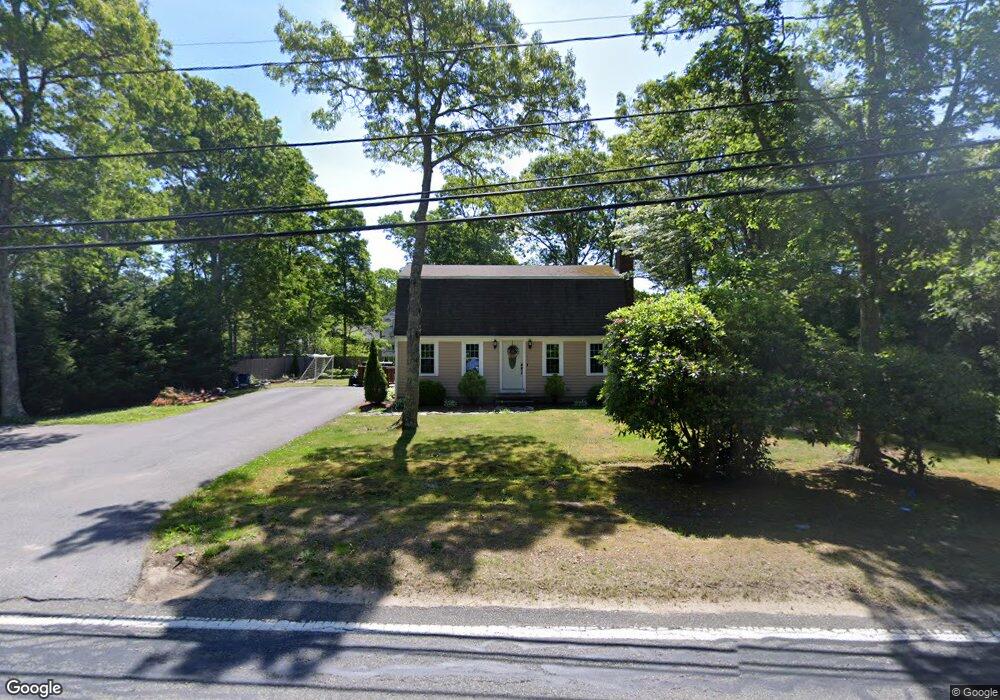
271 S Sandwich Rd Mashpee, MA 02649
Estimated Value: $546,000 - $626,000
4
Beds
2
Baths
1,536
Sq Ft
$375/Sq Ft
Est. Value
About This Home
This home is located at 271 S Sandwich Rd, Mashpee, MA 02649 and is currently estimated at $576,252, approximately $375 per square foot. 271 S Sandwich Rd is a home located in Barnstable County with nearby schools including Kenneth C. Coombs School, Quashnet School, and Mashpee Middle School.
Ownership History
Date
Name
Owned For
Owner Type
Purchase Details
Closed on
Jul 27, 2010
Sold by
Gay Christopher
Bought by
Rose Delwin C
Current Estimated Value
Home Financials for this Owner
Home Financials are based on the most recent Mortgage that was taken out on this home.
Original Mortgage
$185,250
Outstanding Balance
$123,823
Interest Rate
4.76%
Mortgage Type
Purchase Money Mortgage
Estimated Equity
$452,429
Purchase Details
Closed on
Aug 2, 2005
Sold by
Alonso Patricia
Bought by
Gay Christopher
Home Financials for this Owner
Home Financials are based on the most recent Mortgage that was taken out on this home.
Original Mortgage
$195,650
Interest Rate
5.67%
Mortgage Type
Purchase Money Mortgage
Purchase Details
Closed on
Sep 5, 1995
Sold by
Salvaggio Richard A and Galvani Robert J
Bought by
Alonso Patricia
Purchase Details
Closed on
Jun 2, 1994
Sold by
Fhlmc
Bought by
Salvaggio Richard A and Galvani Robert J
Purchase Details
Closed on
Jan 14, 1994
Sold by
Kelly Stephen J
Bought by
Asheville Sb
Create a Home Valuation Report for This Property
The Home Valuation Report is an in-depth analysis detailing your home's value as well as a comparison with similar homes in the area
Home Values in the Area
Average Home Value in this Area
Purchase History
| Date | Buyer | Sale Price | Title Company |
|---|---|---|---|
| Rose Delwin C | $195,000 | -- | |
| Gay Christopher | $279,500 | -- | |
| Alonso Patricia | $101,500 | -- | |
| Salvaggio Richard A | $67,900 | -- | |
| Asheville Sb | $85,000 | -- |
Source: Public Records
Mortgage History
| Date | Status | Borrower | Loan Amount |
|---|---|---|---|
| Open | Rose Delwin C | $185,250 | |
| Previous Owner | Gay Christopher | $195,650 | |
| Previous Owner | Asheville Sb | $185,500 | |
| Previous Owner | Asheville Sb | $168,000 |
Source: Public Records
Tax History Compared to Growth
Tax History
| Year | Tax Paid | Tax Assessment Tax Assessment Total Assessment is a certain percentage of the fair market value that is determined by local assessors to be the total taxable value of land and additions on the property. | Land | Improvement |
|---|---|---|---|---|
| 2025 | $3,148 | $475,500 | $167,500 | $308,000 |
| 2024 | $2,867 | $445,900 | $152,300 | $293,600 |
| 2023 | $2,681 | $382,400 | $145,000 | $237,400 |
| 2022 | $2,678 | $327,800 | $131,000 | $196,800 |
| 2021 | $39 | $288,000 | $118,000 | $170,000 |
| 2020 | $2,519 | $277,100 | $113,500 | $163,600 |
| 2019 | $2,419 | $267,300 | $113,500 | $153,800 |
| 2018 | $29 | $239,100 | $113,500 | $125,600 |
| 2017 | $2,076 | $225,900 | $113,500 | $112,400 |
| 2016 | $2,028 | $219,500 | $113,500 | $106,000 |
| 2015 | $1,947 | $213,700 | $113,500 | $100,200 |
| 2014 | $1,896 | $201,900 | $112,100 | $89,800 |
Source: Public Records
Map
Nearby Homes
- 11 Warwick Way
- 68 Fox Hill Rd
- 22 Candlewood Ln
- 45 Fox Hill Rd
- 16 Balfour Ln
- 131 Timberlane Dr
- 29 Melissa Ave
- 7 Widow Coombs Walk
- 12 Sheffield Place
- 6 Santuit Pond Rd
- 20 Windsor Way
- 42 Beechwood Dr
- 90 Lakewood Dr
- 10 Briar Patch Ln
- 35 Santuit Ln
- 235 Main St
- 24 Center St Unit D
- 9 Santuit Ln
- 67 Redwood Cir
- 84 Harlow Rd
- 277 S Sandwich Rd
- 257 S Sandwich Rd
- 271 S South Sandwich
- 28 Devonshire Dr
- 32 Devonshire Dr
- 22 Devonshire Dr
- 251 S Sandwich Rd
- 34 Devonshire Dr
- 281 S Sandwich Rd
- 18 Devonshire Dr
- 25 Devonshire Dr
- 29 Devonshire Dr
- 247 S Sandwich Rd
- 36 Devonshire Dr
- 21 Devonshire Dr
- 33 Devonshire Dr
- 12 Devonshire Dr
- 15 Devonshire Dr
- 243 S Sandwich Rd
- 293 S Sandwich Rd