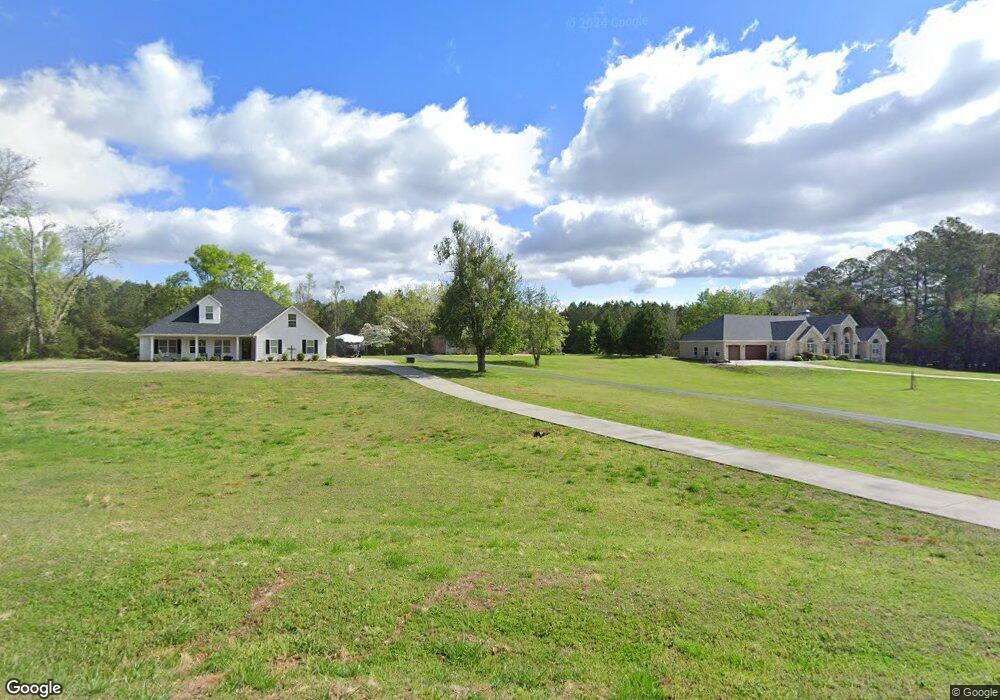
271 Switch Rd SW Calhoun, GA 30701
Estimated Value: $389,000 - $571,000
3
Beds
3
Baths
2,324
Sq Ft
$198/Sq Ft
Est. Value
About This Home
This home is located at 271 Switch Rd SW, Calhoun, GA 30701 and is currently estimated at $461,081, approximately $198 per square foot. 271 Switch Rd SW is a home located in Gordon County with nearby schools including Swain Elementary School, Ashworth Middle School, and Gordon Central High School.
Ownership History
Date
Name
Owned For
Owner Type
Purchase Details
Closed on
Mar 5, 2019
Sold by
Milliken Larry J
Bought by
Larry John Kevin Milliken Joint Rev Trus and Joyce Elaine Milliken Joint Rev Trust
Current Estimated Value
Purchase Details
Closed on
Sep 24, 2010
Sold by
Middendorp Wiebe
Bought by
Millken Larry J and Millken Joyce E
Home Financials for this Owner
Home Financials are based on the most recent Mortgage that was taken out on this home.
Original Mortgage
$200,000
Interest Rate
4.42%
Mortgage Type
New Conventional
Purchase Details
Closed on
Apr 9, 2009
Sold by
Middendorp Wiebe
Bought by
Middendorp Wiebe and Middendorp Carol
Purchase Details
Closed on
Aug 13, 2008
Sold by
Not Provided
Bought by
Milliken Larry J and Milliken Joyce E
Purchase Details
Closed on
Mar 22, 2005
Sold by
Middendorp Hylkje
Bought by
Middendorp Hylkje
Purchase Details
Closed on
Jan 18, 2005
Sold by
Irmscher Sonya
Bought by
Middendorp Hylkje
Create a Home Valuation Report for This Property
The Home Valuation Report is an in-depth analysis detailing your home's value as well as a comparison with similar homes in the area
Home Values in the Area
Average Home Value in this Area
Purchase History
| Date | Buyer | Sale Price | Title Company |
|---|---|---|---|
| Larry John Kevin Milliken Joint Rev Trus | -- | -- | |
| Millken Larry J | $250,000 | -- | |
| Middendorp Wiebe | -- | -- | |
| Middendorp Wiebe | -- | -- | |
| Milliken Larry J | -- | -- | |
| Milliken Larry J | -- | -- | |
| Middendorp Hylkje | -- | -- | |
| Middendorp Hylkje | $41,800 | -- |
Source: Public Records
Mortgage History
| Date | Status | Borrower | Loan Amount |
|---|---|---|---|
| Previous Owner | Millken Larry J | $200,000 |
Source: Public Records
Tax History Compared to Growth
Tax History
| Year | Tax Paid | Tax Assessment Tax Assessment Total Assessment is a certain percentage of the fair market value that is determined by local assessors to be the total taxable value of land and additions on the property. | Land | Improvement |
|---|---|---|---|---|
| 2024 | $2,126 | $148,800 | $7,960 | $140,840 |
| 2023 | $1,870 | $138,720 | $7,960 | $130,760 |
| 2022 | $1,711 | $128,800 | $7,960 | $120,840 |
| 2021 | $1,069 | $104,880 | $7,960 | $96,920 |
| 2020 | $1,043 | $103,560 | $7,960 | $95,600 |
| 2019 | $1,046 | $103,560 | $7,960 | $95,600 |
| 2018 | $900 | $95,400 | $7,960 | $87,440 |
| 2017 | $869 | $90,400 | $7,960 | $82,440 |
| 2016 | $871 | $90,400 | $7,960 | $82,440 |
| 2015 | $861 | $88,680 | $7,960 | $80,720 |
| 2014 | $2,531 | $86,897 | $7,974 | $78,923 |
Source: Public Records
Map
Nearby Homes
- 301 Switch Rd SW
- 1943 Rome Rd SW
- 0 Reeves Station Rd SW Unit 10548197
- 0 Reeves Station Rd SW Unit 7601645
- 187 Cantrell Dr SW
- 0 Highway 53 Spur SW Unit 7529096
- 176 Village Way SW
- 261 Liberty Ln SW
- 159 Moores Ferry Rd SW
- The Braselton II Plan at Fair Oak
- The Reynolds Plan at Fair Oak
- The Buford II Plan at Fair Oak
- The Lawson Plan at Fair Oak
- The Caldwell Plan at Fair Oak
- The Benson II Plan at Fair Oak
- The Greenbrier II Plan at Fair Oak
- 121 Foxhall Dr SW
- 3293 Rome Rd SW
- 130 Brookstone Dr SW
- 221 Hardin Rd SW
- 257 Switch Rd SW
- 0 Switch Rd SW Unit 8553432
- 0 Switch Rd SW
- 7 Williams Way SW
- 444 Switch Rd SW
- 221 Switch Rd SW
- 268 Switch Rd SW
- 244 Switch Rd SW
- 324 Switch Rd SW
- 141 Williams Way SW
- 343 Switch Rd SW
- 342 Switch Rd SW
- 174 Switch Rd SW
- 371 Switch Rd SW
- 167 Switch Rd SW
- 0 Williams Way SW Unit Lot 7 8515333
- 0 Williams Way SW Unit 7016716
- 0 Williams Way SW Unit 7047643
- 00 Williams Way SW
- 182 Williams Way SW