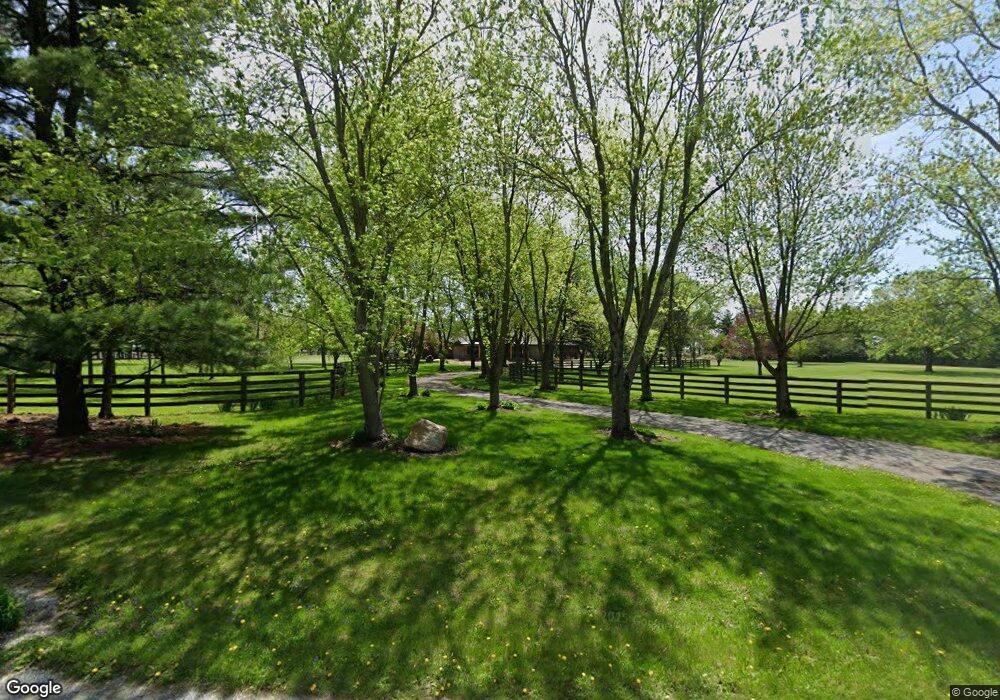
2710 E 800 S Fairmount, IN 46928
Estimated Value: $428,000 - $544,492
4
Beds
3
Baths
2,070
Sq Ft
$239/Sq Ft
Est. Value
About This Home
This home is located at 2710 E 800 S, Fairmount, IN 46928 and is currently estimated at $494,497, approximately $238 per square foot. 2710 E 800 S is a home located in Grant County with nearby schools including Madison-Grant Junior/Senior High School and King's Academy.
Ownership History
Date
Name
Owned For
Owner Type
Purchase Details
Closed on
Apr 25, 2011
Sold by
Fannie Mae
Bought by
Sneed Clifford R and Sneed Katti J
Current Estimated Value
Home Financials for this Owner
Home Financials are based on the most recent Mortgage that was taken out on this home.
Original Mortgage
$289,750
Interest Rate
4.86%
Mortgage Type
New Conventional
Purchase Details
Closed on
Mar 10, 2011
Sold by
Hopper Jason
Bought by
Federal National Mortgage Association and Fannie Mae
Home Financials for this Owner
Home Financials are based on the most recent Mortgage that was taken out on this home.
Original Mortgage
$289,750
Interest Rate
4.86%
Mortgage Type
New Conventional
Purchase Details
Closed on
Oct 18, 2000
Sold by
Not Provided
Bought by
Not Provided
Create a Home Valuation Report for This Property
The Home Valuation Report is an in-depth analysis detailing your home's value as well as a comparison with similar homes in the area
Purchase History
| Date | Buyer | Sale Price | Title Company |
|---|---|---|---|
| Sneed Clifford R | -- | Statewide Title Company | |
| Federal National Mortgage Association | $285,152 | None Available | |
| Not Provided | $265,000 | -- |
Source: Public Records
Mortgage History
| Date | Status | Borrower | Loan Amount |
|---|---|---|---|
| Closed | Sneed Clifford R | $289,750 |
Source: Public Records
Tax History
| Year | Tax Paid | Tax Assessment Tax Assessment Total Assessment is a certain percentage of the fair market value that is determined by local assessors to be the total taxable value of land and additions on the property. | Land | Improvement |
|---|---|---|---|---|
| 2025 | $3,525 | $507,000 | $91,400 | $415,600 |
| 2024 | $3,525 | $457,300 | $91,400 | $365,900 |
| 2023 | $4,290 | $482,300 | $91,400 | $390,900 |
| 2022 | $4,255 | $435,000 | $91,400 | $343,600 |
| 2021 | $3,881 | $370,900 | $82,900 | $288,000 |
| 2020 | $3,438 | $363,100 | $82,900 | $280,200 |
| 2019 | $3,339 | $352,700 | $82,900 | $269,800 |
| 2018 | $2,719 | $303,400 | $69,100 | $234,300 |
| 2017 | $2,465 | $302,100 | $69,100 | $233,000 |
| 2016 | $2,248 | $289,100 | $65,600 | $223,500 |
| 2014 | $1,846 | $250,000 | $65,600 | $184,400 |
| 2013 | $1,846 | $249,200 | $65,600 | $183,600 |
Source: Public Records
Map
Nearby Homes
- 1316 N Factory St
- 705 E Third St
- 6597 S 150 E
- 401 E 2nd St
- 432 N Main St
- 407 S Penn St
- 313 N Mill St
- 115 S Walnut St
- 502 Seward Ln
- 109 N Mill St
- 1614 Muncie Pike
- 227 E 11th St
- 605 W 10th St
- 220 E 950 S
- 220 E 950 S Unit Fairmount
- 6611 S 500 E
- 213 E South G St
- 1340 E 1100 S
- 206 S Main St
- 416 E South D St
Your Personal Tour Guide
Ask me questions while you tour the home.