2710 Le Conte Ave Unit 3 Berkeley, CA 94709
North Berkeley NeighborhoodAbout This Home
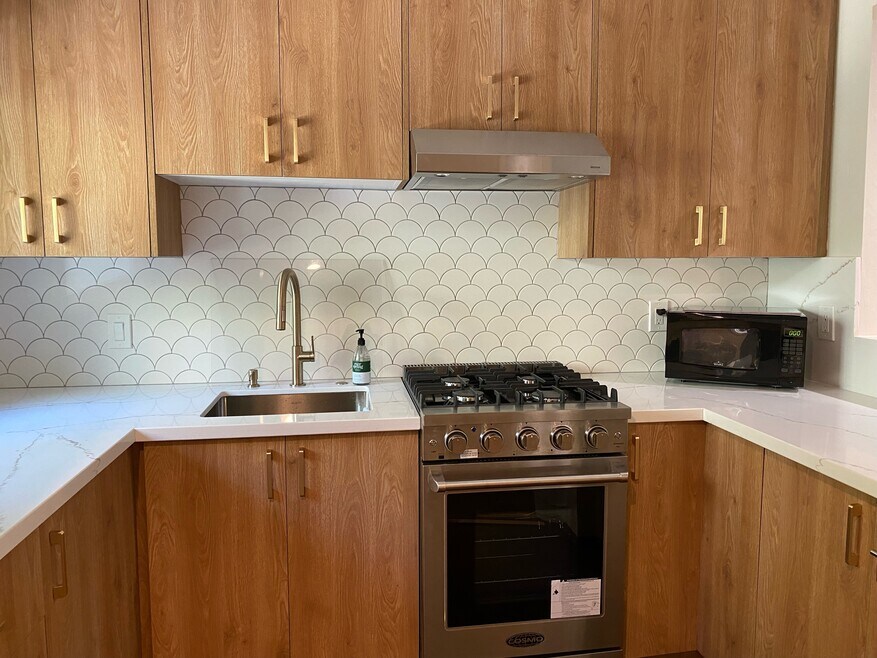
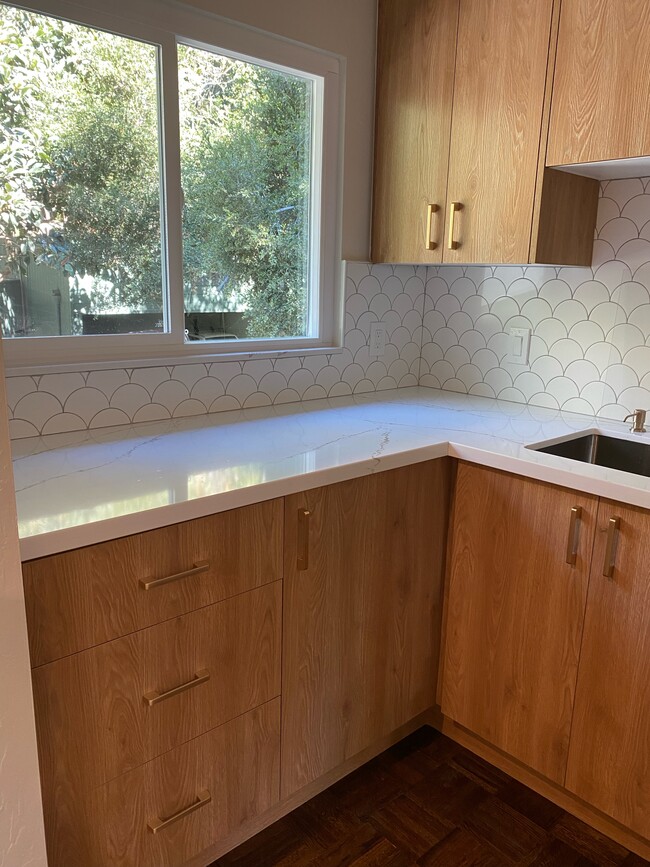
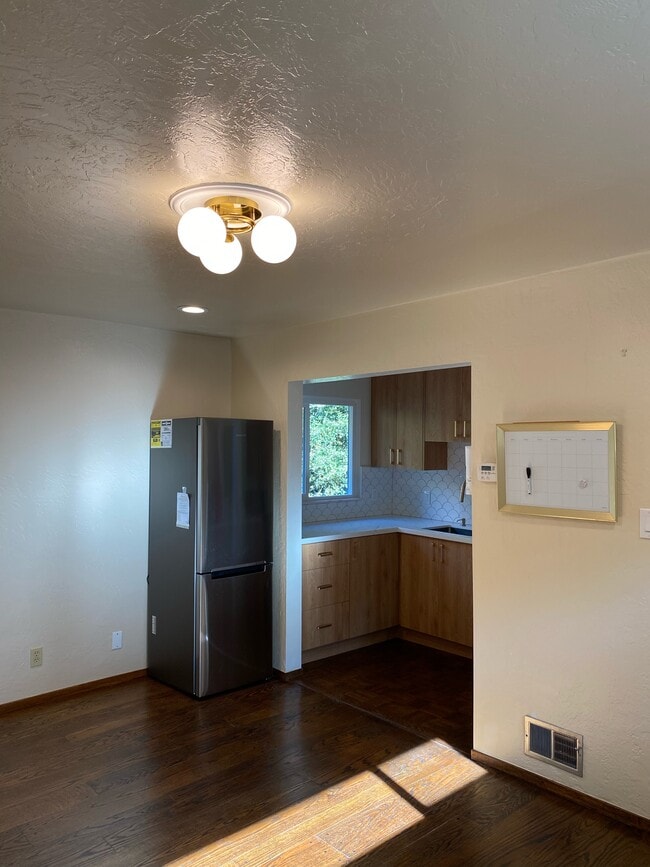
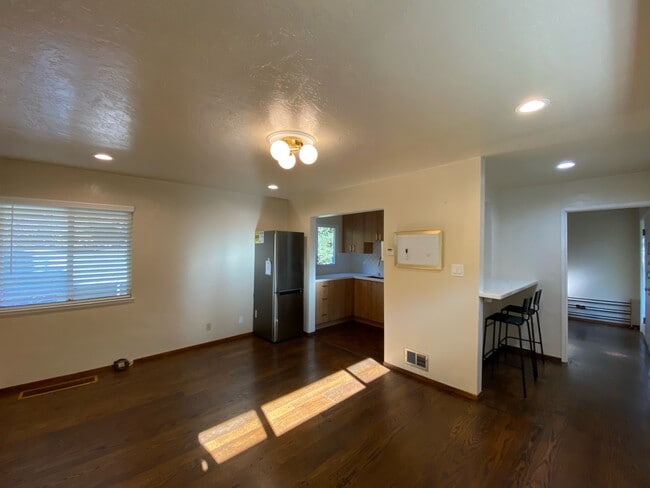
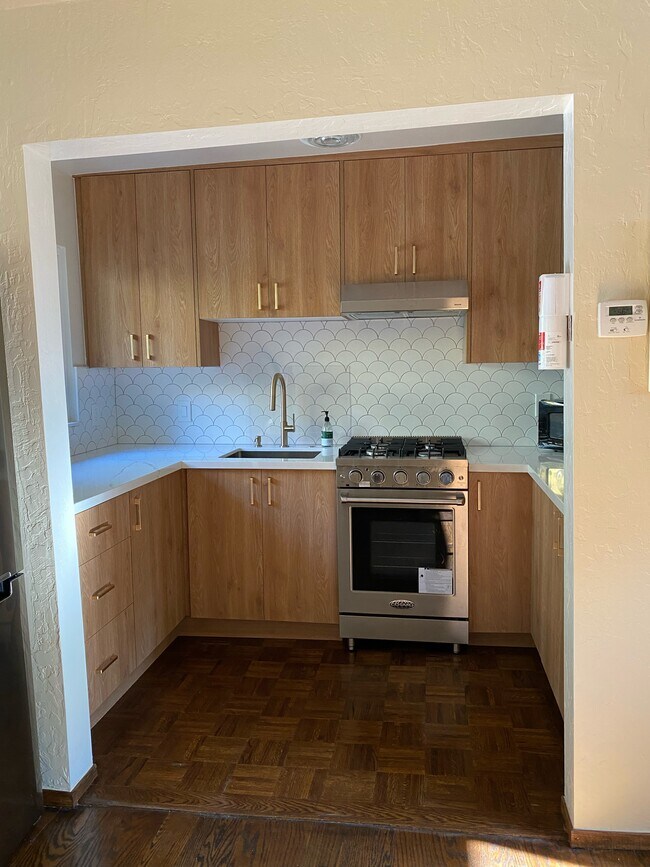
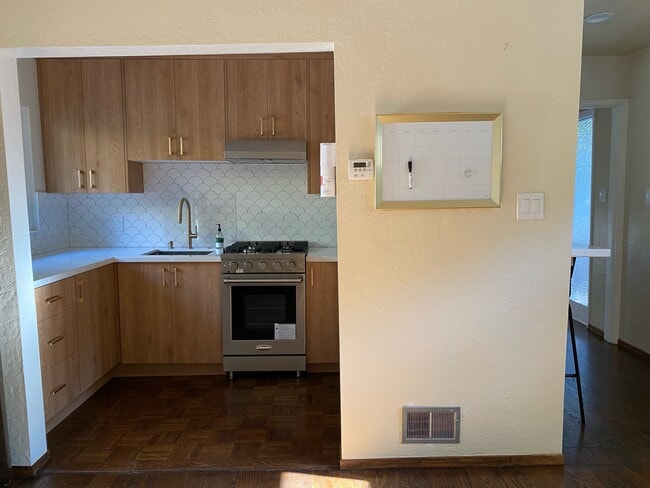
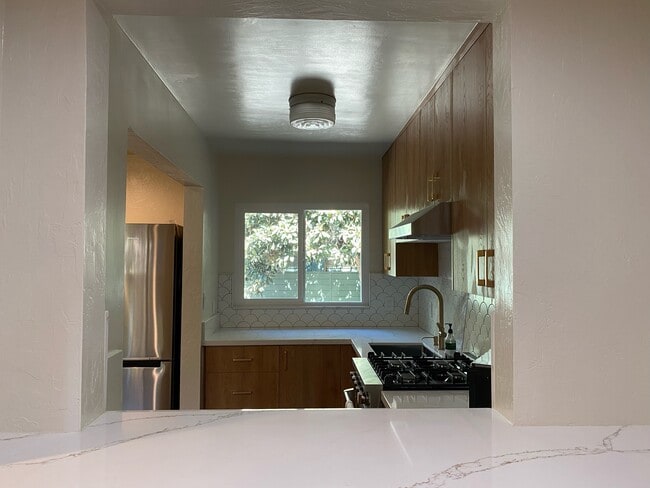
This lovely, Midcentury Modern, one bedroom, one bath, unfurnished condo in a wooded setting is just two blocks to the Northside of the UC Berkeley campus. Remodeled kitchen featuring eat-in bar counter, stainless steel appliances, ample cabinets and counter space. Remodeled bathroom with storage/shelf space. Laundry facilities available in the common building. Very well-maintained, neat, clean and ready to move-in on June 1, 2026. One carport parking directly below the unit. Private entrance. No units above or below. Very convenient and excellent location, walk to campus - close to Soda Hall, restaurants, and coffee shops on Euclid Ave. No Pets, No Smoking, No Drugs, No AirBnB/Subletting Allowed. Renter's insurance is required. Maximum occupancy is 2 adult persons, for additional $100/month. Security deposit is 1.5x monthly rent. Applicants will be screened based on credit history, rental history, and income.

Condo Details
Property Information
- Built in 1955
- 1 unit
Utilities Included
- Water
- Trash Removal
Condo Features
- Smoke Free
Property Services
- Laundry Facilities
Kitchen Features & Appliances
- Kitchen
- Stainless Steel Appliances
Map
Property History
| Date | Event | Price | List to Sale | Price per Sq Ft |
|---|---|---|---|---|
| 03/30/2026 03/30/26 | For Rent | $2,595 | 0.0% | -- |
| 11/20/2025 11/20/25 | Off Market | $2,595 | -- | -- |
| 10/21/2025 10/21/25 | For Rent | $2,595 | -- | -- |
- 2700 Le Conte Ave Unit 301
- 2700 Le Conte Ave Unit 402
- 1698 La Loma Ave Unit 1698
- 2634 Virginia St Unit 33
- 2600 Hilgard Ave
- 2477 Virginia St
- 2451 Le Conte Ave
- 2421 Hilgard Ave
- 2340 Virginia St
- 1622 Scenic Ave
- 2301 Virginia St Unit 1
- 1739 Spruce St
- 2501 Rose Walk
- 0 Panoramic Way Unit 41118724
- 39 Canyon Rd
- 230 Fairlawn Dr
- 2201 Virginia St Unit 2
- 2 Panoramic Way Unit 105
- 2 Panoramic Way Unit 304
- 1682 Oxford St
- 1771 Highland Place
- 2600 Ridge Rd
- 1780 Le Roy Ave Unit 12
- 2531 Ridge Rd Unit 2
- 2531 Ridge Rd Unit 4
- 2531 Ridge Rd Unit 6
- 2573 Virginia St
- 2573 Virginia St
- 2571 Virginia St Unit 1
- 2554 Virginia St
- 2548 Virginia St Unit A
- 1799 Euclid Ave
- 1810 Euclid Ave Unit 22
- 1810 Euclid Ave Unit 5
- 1865-1879 Euclid Ave
- 1708 Euclid Ave Unit 3
- 2480 Virginia St Unit 3
- 2480 Virginia St Unit 5a
- 2422-2422 Ridge Rd
- 2342 Hilgard Ave Unit 2342
Ask me questions while you tour the home.