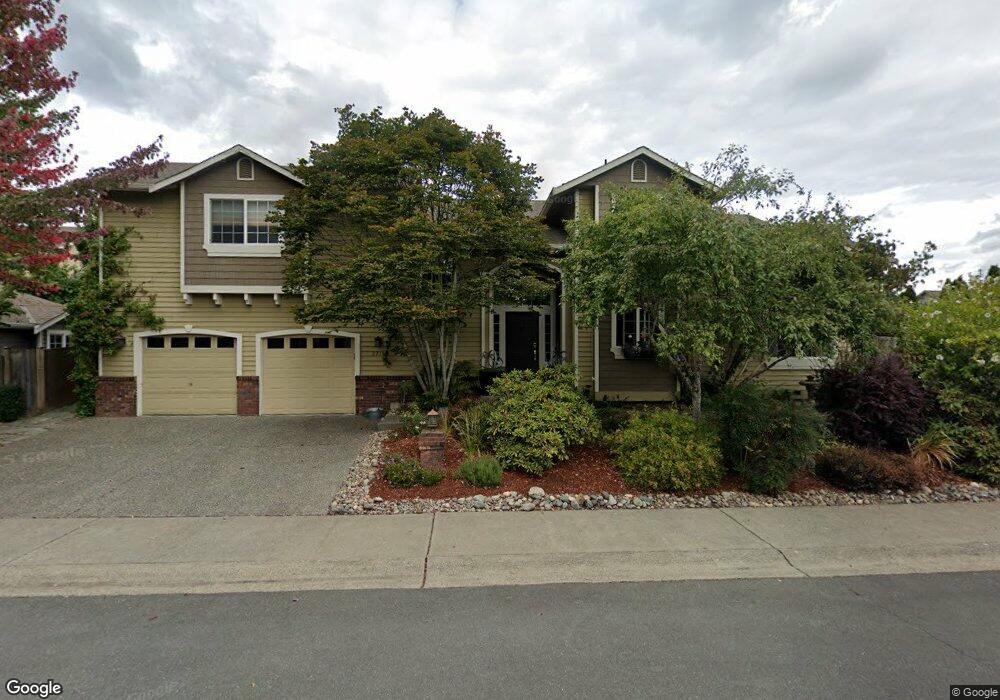
2711 182nd Place SE Bothell, WA 98012
North Creek NeighborhoodEstimated Value: $1,023,000 - $1,169,000
4
Beds
3
Baths
2,162
Sq Ft
$515/Sq Ft
Est. Value
About This Home
This home is located at 2711 182nd Place SE, Bothell, WA 98012 and is currently estimated at $1,113,869, approximately $515 per square foot. 2711 182nd Place SE is a home located in Snohomish County with nearby schools including Fernwood Elementary School, Skyview Middle School, and North Creek High School.
Ownership History
Date
Name
Owned For
Owner Type
Purchase Details
Closed on
Aug 29, 1999
Sold by
Park Robert R and Park Jennifer
Bought by
Park Robert R and Park Jennifer
Current Estimated Value
Purchase Details
Closed on
Jan 4, 1999
Sold by
Our Land Inc
Bought by
Leisure Steven R and Leisure Kimberly
Home Financials for this Owner
Home Financials are based on the most recent Mortgage that was taken out on this home.
Original Mortgage
$155,368
Outstanding Balance
$31,051
Interest Rate
6.73%
Mortgage Type
FHA
Estimated Equity
$1,082,818
Purchase Details
Closed on
Jan 1, 1999
Sold by
Wagner Richard E and Wagner Esther L
Bought by
Park Robert R and Park Jennifer R
Home Financials for this Owner
Home Financials are based on the most recent Mortgage that was taken out on this home.
Original Mortgage
$155,368
Outstanding Balance
$31,051
Interest Rate
6.73%
Mortgage Type
FHA
Estimated Equity
$1,082,818
Create a Home Valuation Report for This Property
The Home Valuation Report is an in-depth analysis detailing your home's value as well as a comparison with similar homes in the area
Home Values in the Area
Average Home Value in this Area
Purchase History
| Date | Buyer | Sale Price | Title Company |
|---|---|---|---|
| Park Robert R | -- | -- | |
| Leisure Steven R | $156,650 | Evergreen Title Company Inc | |
| Park Robert R | $247,000 | Evergreen Title Company Inc |
Source: Public Records
Mortgage History
| Date | Status | Borrower | Loan Amount |
|---|---|---|---|
| Open | Leisure Steven R | $155,368 | |
| Open | Park Robert R | $222,300 |
Source: Public Records
Tax History
| Year | Tax Paid | Tax Assessment Tax Assessment Total Assessment is a certain percentage of the fair market value that is determined by local assessors to be the total taxable value of land and additions on the property. | Land | Improvement |
|---|---|---|---|---|
| 2026 | $9,027 | $1,025,400 | $675,000 | $350,400 |
| 2025 | $8,466 | $1,006,500 | $669,800 | $336,700 |
| 2024 | $8,466 | $944,100 | $619,000 | $325,100 |
| 2023 | $8,767 | $1,090,500 | $715,000 | $375,500 |
| 2022 | $7,616 | $752,600 | $430,000 | $322,600 |
| 2020 | $7,208 | $672,400 | $398,000 | $274,400 |
| 2019 | $6,208 | $585,000 | $310,000 | $275,000 |
| 2018 | $5,819 | $510,400 | $265,000 | $245,400 |
| 2017 | $4,967 | $442,800 | $214,000 | $228,800 |
| 2016 | $4,761 | $414,200 | $195,000 | $219,200 |
| 2015 | $4,686 | $387,300 | $179,000 | $208,300 |
| 2013 | $4,195 | $308,200 | $146,000 | $162,200 |
Source: Public Records
Map
Nearby Homes
- 18309 26th Dr SE
- 18501 28th Ave SE
- 3028 183rd Place SE
- 2401 185th Place SE
- 18223 31st Ave SE
- 18632 29th Ave SE
- 3205 179th Place SE
- 18429 20th Dr SE
- 18115 34th Dr SE
- 17529 Brook Blvd
- 18809 20th Dr SE
- 3414 176th Place SE
- 18725 35th Dr SE
- 19218 26th Ave SE Unit 117
- 3413 189th Place SE
- 19102 20th Dr SE Unit B204
- 19102 20th Dr SE Unit B202
- 19102 20th Dr SE Unit B206
- 3125 194th St SE
- 17913 38th Dr SE Unit 20
- 18124 27th Dr SE
- 2710 181st Place SE
- 2707 182nd Place SE
- 2704 181st Place SE
- 2708 182nd Place SE
- 18127 27th Dr SE
- 18210 27th Dr SE
- 18205 27th Dr SE
- 2732 181st Place SE
- 18214 27th Dr SE
- 18131 26th Dr SE
- 18209 27th Dr SE
- 18123 26th Dr SE
- 18205 26th Dr SE
- 18112 27th Dr SE
- 18118 28th Dr SE Unit 32
- 2705 181st Place SE
- 18114 28th Dr SE Unit 31
- 18124 28th Dr SE Unit 33
Your Personal Tour Guide
Ask me questions while you tour the home.