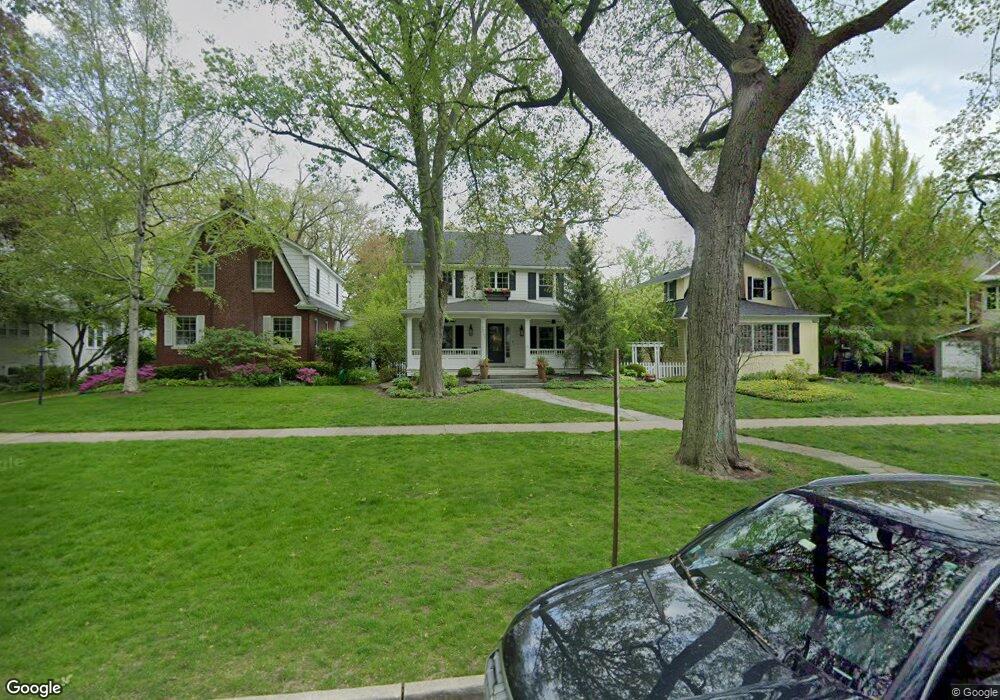
2711 Broadway Ave Evanston, IL 60201
Estimated Value: $1,071,000 - $1,418,000
4
Beds
3
Baths
3,156
Sq Ft
$384/Sq Ft
Est. Value
About This Home
This home is located at 2711 Broadway Ave, Evanston, IL 60201 and is currently estimated at $1,211,538, approximately $383 per square foot. 2711 Broadway Ave is a home located in Cook County with nearby schools including Kingsley Elementary School, Haven Middle School, and Evanston Township High School.
Ownership History
Date
Name
Owned For
Owner Type
Purchase Details
Closed on
Jun 22, 2017
Sold by
Enright John R and Enright Jennifer R
Bought by
Nuss Angela R
Current Estimated Value
Home Financials for this Owner
Home Financials are based on the most recent Mortgage that was taken out on this home.
Original Mortgage
$797,780
Outstanding Balance
$662,128
Interest Rate
3.94%
Mortgage Type
Adjustable Rate Mortgage/ARM
Estimated Equity
$549,410
Purchase Details
Closed on
May 29, 2009
Sold by
Amato John Thomas and Amato Kathleen
Bought by
Enright John R and Enright Jennifer R
Home Financials for this Owner
Home Financials are based on the most recent Mortgage that was taken out on this home.
Original Mortgage
$416,250
Interest Rate
4.85%
Mortgage Type
Unknown
Create a Home Valuation Report for This Property
The Home Valuation Report is an in-depth analysis detailing your home's value as well as a comparison with similar homes in the area
Home Values in the Area
Average Home Value in this Area
Purchase History
| Date | Buyer | Sale Price | Title Company |
|---|---|---|---|
| Nuss Angela R | $997,500 | Chicago Title | |
| Enright John R | $555,000 | Fort Dearborn Land Title Llc |
Source: Public Records
Mortgage History
| Date | Status | Borrower | Loan Amount |
|---|---|---|---|
| Open | Nuss Angela R | $797,780 | |
| Previous Owner | Enright John R | $416,250 |
Source: Public Records
Tax History Compared to Growth
Tax History
| Year | Tax Paid | Tax Assessment Tax Assessment Total Assessment is a certain percentage of the fair market value that is determined by local assessors to be the total taxable value of land and additions on the property. | Land | Improvement |
|---|---|---|---|---|
| 2024 | $18,619 | $76,911 | $18,895 | $58,016 |
| 2023 | $17,865 | $76,911 | $18,895 | $58,016 |
| 2022 | $17,865 | $76,911 | $18,895 | $58,016 |
| 2021 | $17,581 | $66,247 | $12,322 | $53,925 |
| 2020 | $18,963 | $72,422 | $12,322 | $60,100 |
| 2019 | $18,505 | $78,978 | $12,322 | $66,656 |
| 2018 | $15,968 | $58,284 | $10,268 | $48,016 |
| 2017 | $14,651 | $58,284 | $10,268 | $48,016 |
| 2016 | $16,781 | $68,805 | $10,268 | $58,537 |
| 2015 | $14,941 | $58,346 | $8,625 | $49,721 |
| 2014 | $14,813 | $58,346 | $8,625 | $49,721 |
| 2013 | $14,457 | $58,346 | $8,625 | $49,721 |
Source: Public Records
Map
Nearby Homes
- 2635 Poplar Ave
- 2741 Eastwood Ave
- 2539.5 Prairie Ave Unit 3W
- 2135 Central St Unit 3W
- 2108 Harrison St
- 2015 Colfax St
- 2020 Colfax St
- 1915 Grant St
- 250 3rd St
- 526 Linden Ave
- 1910 Grant St
- 1918 Noyes St
- 1209 Maple Ave
- 1241 Maple Ave
- 2017 Jackson Ave
- 2720 Central St Unit 4C
- 410 Prairie Ave
- 1025 Central Ave
- 2118 Jackson Ave
- 1303 Maple Ave
- 2715 Broadway Ave
- 2707 Broadway Ave
- 2719 Broadway Ave
- 1809 Livingston St
- 1803 Livingston St
- 2725 Broadway Ave
- 2727 Broadway Ave
- 2657 Broadway Ave
- 2653 Broadway Ave
- 2708 Broadway Ave
- 2712 Broadway Ave
- 2716 Broadway Ave
- 2704 Broadway Ave
- 2700 Broadway Ave
- 2720 Broadway Ave
- 2656 Broadway Ave
- 2651 Broadway Ave
- 1728 Livingston St
- 2730 Broadway Ave
- 2730 Broadway Ave