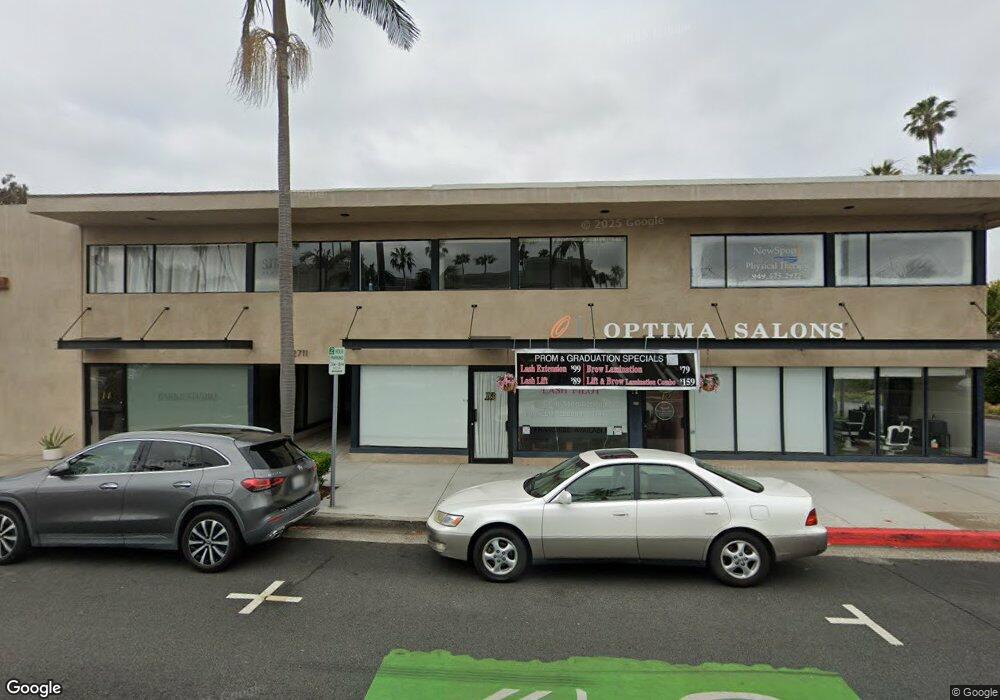
2711 E Coast Hwy Corona Del Mar, CA 92625
Corona Del Mar Neighborhood
--
Bed
--
Bath
13,678
Sq Ft
3,920
Sq Ft Lot
About This Home
This home is located at 2711 E Coast Hwy, Corona Del Mar, CA 92625. 2711 E Coast Hwy is a home located in Orange County with nearby schools including Harbor View Elementary School, Corona del Mar Middle and High School, and Harbor Day School.
Ownership History
Date
Name
Owned For
Owner Type
Purchase Details
Closed on
May 12, 2017
Sold by
2711 E Coast Hwy Llc
Bought by
The Masters Building Llc
Home Financials for this Owner
Home Financials are based on the most recent Mortgage that was taken out on this home.
Original Mortgage
$35,000,000
Outstanding Balance
$29,106,821
Interest Rate
4.1%
Mortgage Type
Commercial
Purchase Details
Closed on
May 26, 2016
Sold by
Masters Properties
Bought by
2711 E Coast Hwy Llc
Purchase Details
Closed on
May 20, 2016
Sold by
Ribakoff Alan P
Bought by
Masters Christine and Ribakoff Christine Masters
Purchase Details
Closed on
Dec 2, 2004
Sold by
Masters Christine
Bought by
Masters Properties
Purchase Details
Closed on
Jan 1, 2003
Sold by
Masters Charles W
Bought by
Masters Properties
Create a Home Valuation Report for This Property
The Home Valuation Report is an in-depth analysis detailing your home's value as well as a comparison with similar homes in the area
Home Values in the Area
Average Home Value in this Area
Purchase History
| Date | Buyer | Sale Price | Title Company |
|---|---|---|---|
| The Masters Building Llc | -- | Chicago Title Company | |
| 2711 E Coast Hwy Llc | $8,500,000 | First American Title | |
| Masters Charles W | -- | First American Title | |
| Masters Christine | -- | First American Title | |
| Masters Properties | -- | -- | |
| Masters Christine | -- | -- | |
| Masters Charles W | -- | -- | |
| Masters Properties | -- | -- | |
| Masters Charles W | -- | -- |
Source: Public Records
Mortgage History
| Date | Status | Borrower | Loan Amount |
|---|---|---|---|
| Open | The Masters Building Llc | $35,000,000 |
Source: Public Records
Tax History Compared to Growth
Tax History
| Year | Tax Paid | Tax Assessment Tax Assessment Total Assessment is a certain percentage of the fair market value that is determined by local assessors to be the total taxable value of land and additions on the property. | Land | Improvement |
|---|---|---|---|---|
| 2025 | $44,865 | $4,086,465 | $2,770,086 | $1,316,379 |
| 2024 | $44,865 | $4,006,339 | $2,715,771 | $1,290,568 |
| 2023 | $43,791 | $3,927,784 | $2,662,521 | $1,265,263 |
| 2022 | $43,037 | $3,850,769 | $2,610,315 | $1,240,454 |
| 2021 | $42,227 | $3,775,264 | $2,559,132 | $1,216,132 |
| 2020 | $41,818 | $3,736,554 | $2,532,891 | $1,203,663 |
| 2019 | $40,991 | $3,663,289 | $2,483,227 | $1,180,062 |
| 2018 | $40,189 | $3,591,460 | $2,434,536 | $1,156,924 |
| 2017 | $39,490 | $3,521,040 | $2,386,800 | $1,134,240 |
| 2016 | $6,411 | $383,114 | $121,077 | $262,037 |
| 2015 | $6,337 | $377,360 | $119,259 | $258,101 |
| 2014 | $6,199 | $369,969 | $116,923 | $253,046 |
Source: Public Records
Map
Nearby Homes
- 516 1/2 Larkspur (Rear Home) Ave
- 508 Goldenrod Ave
- 435 Fernleaf Ave Unit 1
- 708 Heliotrope Ave
- 509 Carnation Ave
- 429 Dahlia Ave
- 618 Iris Ave Unit B
- 604 Begonia Ave
- 407 1/2 Goldenrod Ave
- 516 Iris Ave
- 514 Iris Ave
- 611 .5 Jasmine Ave
- 714 1/2 Iris Ave
- 2616 Bungalow Place Unit 59
- 412 Heliotrope Ave
- 2578 Bungalow Place Unit 68
- 2548 Bungalow Place Unit 84
- 2516 Bayside Dr
- 508 1/2 Acacia Ave
- 502 Jasmine Ave Unit A
- 2721 E Coast Hwy
- 2721 E Coast Hwy Unit 204
- 2721 E Coast Hwy Unit 105
- 2721 E Coast Hwy Unit 107
- 2721 E Coast Hwy Unit 200
- 2721 E Coast Hwy Unit 106
- 2721 E Coast Hwy Unit 104
- 2737 E Coast Hwy
- 520 Fernleaf Ave
- 518 Fernleaf Ave
- 611 Goldenrod Ave
- 516 Fernleaf Ave
- 519 5 Fernleaf Ave
- 519 Fernleaf Ave Unit Front
- 519 Fernleaf Ave
- 519 1/2 Fernleaf Ave
- 521 Fernleaf Ave
- 517 Fernleaf Ave Unit 3
- 517 Fernleaf Ave
- 514 1/2 Fernleaf Ave