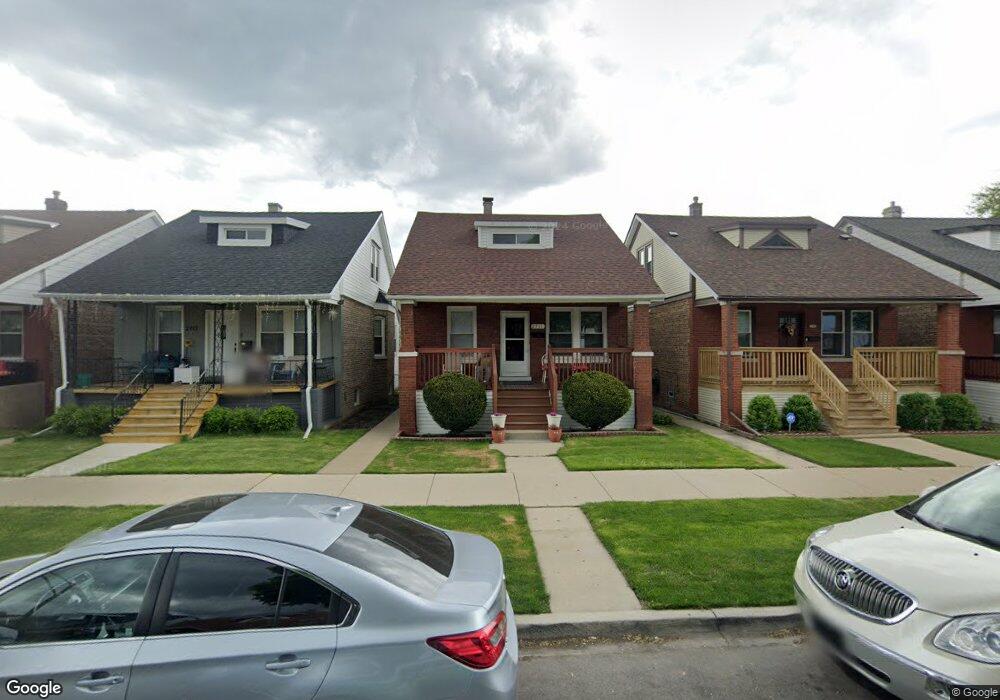
2711 N Major Ave Chicago, IL 60639
Belmont Central NeighborhoodEstimated Value: $308,000 - $426,000
3
Beds
3
Baths
1,199
Sq Ft
$305/Sq Ft
Est. Value
About This Home
This home is located at 2711 N Major Ave, Chicago, IL 60639 and is currently estimated at $365,749, approximately $305 per square foot. 2711 N Major Ave is a home located in Cook County with nearby schools including Schubert Elementary School, Northwest Middle School, and Steinmetz College Prep.
Ownership History
Date
Name
Owned For
Owner Type
Purchase Details
Closed on
Aug 1, 2012
Sold by
Cabrera Luis R and Marquez Maria D
Bought by
Cabrera Mauricio and Marquez Maria D
Current Estimated Value
Purchase Details
Closed on
Jul 25, 2012
Sold by
Cabrera Luis R and Cabrera Mauricio
Bought by
Cabrera Luis R and Marquez Maria D
Purchase Details
Closed on
Oct 28, 1999
Sold by
Tovar Juan Carlos and Tovar Lorena
Bought by
Cabrera Louis R and Cabrera Mauricio
Home Financials for this Owner
Home Financials are based on the most recent Mortgage that was taken out on this home.
Original Mortgage
$152,000
Outstanding Balance
$46,298
Interest Rate
7.72%
Estimated Equity
$319,451
Purchase Details
Closed on
Jun 6, 1996
Sold by
Walavich Leonard
Bought by
Tovar Juan Carlos
Home Financials for this Owner
Home Financials are based on the most recent Mortgage that was taken out on this home.
Original Mortgage
$78,750
Interest Rate
8.05%
Create a Home Valuation Report for This Property
The Home Valuation Report is an in-depth analysis detailing your home's value as well as a comparison with similar homes in the area
Home Values in the Area
Average Home Value in this Area
Purchase History
| Date | Buyer | Sale Price | Title Company |
|---|---|---|---|
| Cabrera Mauricio | -- | None Available | |
| Cabrera Luis R | -- | None Available | |
| Cabrera Louis R | $160,000 | -- | |
| Tovar Juan Carlos | $105,000 | Attorneys Title Guaranty Fun |
Source: Public Records
Mortgage History
| Date | Status | Borrower | Loan Amount |
|---|---|---|---|
| Open | Cabrera Louis R | $152,000 | |
| Previous Owner | Tovar Juan Carlos | $78,750 |
Source: Public Records
Tax History Compared to Growth
Tax History
| Year | Tax Paid | Tax Assessment Tax Assessment Total Assessment is a certain percentage of the fair market value that is determined by local assessors to be the total taxable value of land and additions on the property. | Land | Improvement |
|---|---|---|---|---|
| 2024 | $2,176 | $25,000 | $6,882 | $18,118 |
| 2023 | $2,188 | $22,000 | $5,580 | $16,420 |
| 2022 | $2,188 | $22,000 | $5,580 | $16,420 |
| 2021 | $2,083 | $22,000 | $5,580 | $16,420 |
| 2020 | $2,150 | $20,208 | $4,092 | $16,116 |
| 2019 | $2,143 | $22,706 | $4,092 | $18,614 |
| 2018 | $2,111 | $22,706 | $4,092 | $18,614 |
| 2017 | $2,260 | $22,025 | $3,720 | $18,305 |
| 2016 | $3,556 | $22,025 | $3,720 | $18,305 |
| 2015 | $2,548 | $22,025 | $3,720 | $18,305 |
| 2014 | $2,606 | $18,439 | $3,348 | $15,091 |
| 2013 | $2,877 | $18,439 | $3,348 | $15,091 |
Source: Public Records
Map
Nearby Homes
- 2735 N Mango Ave
- 2714 N Mango Ave
- 2728 N Mango Ave
- 2851 N Major Ave
- 2531 N Major Ave
- 5505 W Parker Ave
- 5512 W Wrightwood Ave
- 5836 W Diversey Ave
- 2537 N Luna Ave
- 2744 N Marmora Ave
- 2632 N Marmora Ave
- 2448 N Major Ave
- 2430 N Central Ave
- 2419 N Central Ave
- 2515 N Lotus Ave
- 2503 N Lotus Ave
- 2630 N Austin Ave
- 5330 W Drummond Place
- 2341 N Major Ave
- 3036 N Luna Ave
- 2713 N Major Ave
- 2717 N Major Ave
- 2705 N Major Ave
- 2719 N Major Ave
- 2701 N Major Ave
- 2723 N Major Ave
- 2710 N Parkside Ave
- 2712 N Parkside Ave
- 2706 N Parkside Ave
- 2725 N Major Ave
- 2716 N Parkside Ave
- 2704 N Parkside Ave
- 2718 N Parkside Ave
- 2700 N Parkside Ave
- 2729 N Major Ave
- 2722 N Parkside Ave
- 2710 N Major Ave
- 2706 N Major Ave