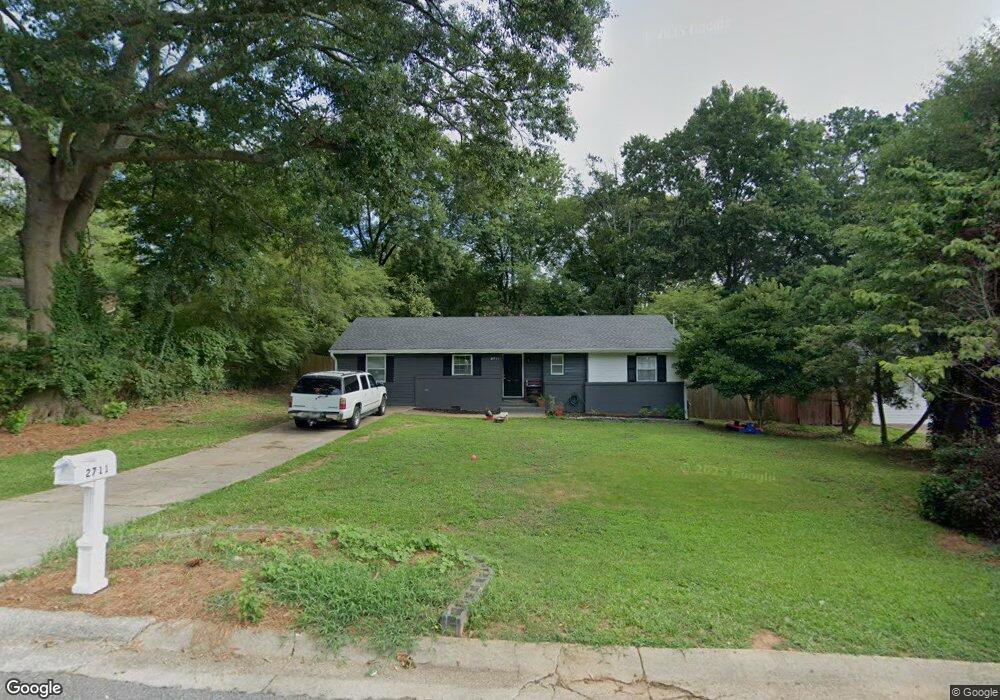
2711 Sherwood Rd SE Unit GA Smyrna, GA 30082
Estimated Value: $287,000 - $346,000
3
Beds
2
Baths
1,149
Sq Ft
$281/Sq Ft
Est. Value
About This Home
This home is located at 2711 Sherwood Rd SE Unit GA, Smyrna, GA 30082 and is currently estimated at $323,280, approximately $281 per square foot. 2711 Sherwood Rd SE Unit GA is a home located in Cobb County with nearby schools including Norton Park Elementary School, Griffin Middle School, and Campbell High School.
Ownership History
Date
Name
Owned For
Owner Type
Purchase Details
Closed on
Sep 3, 2021
Sold by
S O Business Solutions Inc
Bought by
Rs Rental I Llc
Current Estimated Value
Purchase Details
Closed on
May 22, 2018
Sold by
Echols Eli A
Bought by
So Business Solutions Inc
Home Financials for this Owner
Home Financials are based on the most recent Mortgage that was taken out on this home.
Original Mortgage
$213,566
Interest Rate
4.5%
Mortgage Type
New Conventional
Purchase Details
Closed on
Nov 8, 2000
Sold by
Langston Yancey F
Bought by
Maitland Lee T and Maitland Shelia B
Home Financials for this Owner
Home Financials are based on the most recent Mortgage that was taken out on this home.
Original Mortgage
$80,910
Interest Rate
7.87%
Mortgage Type
New Conventional
Create a Home Valuation Report for This Property
The Home Valuation Report is an in-depth analysis detailing your home's value as well as a comparison with similar homes in the area
Home Values in the Area
Average Home Value in this Area
Purchase History
| Date | Buyer | Sale Price | Title Company |
|---|---|---|---|
| Rs Rental I Llc | $287,500 | Hankin & Pack Llc | |
| So Business Solutions Inc | $129,000 | -- | |
| Maitland Lee T | $89,900 | -- |
Source: Public Records
Mortgage History
| Date | Status | Borrower | Loan Amount |
|---|---|---|---|
| Previous Owner | So Business Solutions Inc | $213,566 | |
| Previous Owner | Maitland Lee T | $80,910 |
Source: Public Records
Tax History Compared to Growth
Tax History
| Year | Tax Paid | Tax Assessment Tax Assessment Total Assessment is a certain percentage of the fair market value that is determined by local assessors to be the total taxable value of land and additions on the property. | Land | Improvement |
|---|---|---|---|---|
| 2025 | $3,428 | $126,208 | $30,000 | $96,208 |
| 2024 | $3,428 | $126,208 | $30,000 | $96,208 |
| 2023 | $3,126 | $115,084 | $30,000 | $85,084 |
| 2022 | $3,036 | $110,956 | $30,000 | $80,956 |
| 2021 | $2,598 | $94,524 | $30,000 | $64,524 |
| 2020 | $2,269 | $82,548 | $26,000 | $56,548 |
| 2019 | $1,418 | $51,600 | $21,320 | $30,280 |
| 2018 | $1,069 | $53,232 | $22,000 | $31,232 |
| 2017 | $528 | $30,404 | $10,000 | $20,404 |
| 2016 | $486 | $28,760 | $10,000 | $18,760 |
| 2015 | $330 | $22,360 | $10,000 | $12,360 |
| 2014 | $334 | $22,360 | $0 | $0 |
Source: Public Records
Map
Nearby Homes
- 2654 Estelle Ct SE
- 2771 Sherwood Rd SE
- 2831 Ivanhoe Ln SE
- 119 Still Pine Bend
- 2618 Birch St SE
- 436 Floyd St SE
- 729 Timberland St SE
- 740 Powder Springs St SE
- 1007 Oaks Pkwy SE
- 2041 White Cypress Ct
- 2510 Glendale Cir SE
- 2491 Pasadena Place SE
- 839 Wayland Ct SE
- 235 Still Pine Bend
- 800 Wayland Ct SE
- 259 Diane Dr SE
- 260 Diane Dr SE
- 2711 Sherwood Rd SE
- 2721 Sherwood Rd SE
- 2731 Ivanhoe Ln SE
- 2721 Ivanhoe Ln SE
- 520 Powder Springs St SE
- 2731 Sherwood Rd SE
- 528 Powder Springs St SE
- 2710 Sherwood Rd SE
- 2711 Ivanhoe Ln SE
- 2755 Ivanhoe Ln SE
- 2720 Sherwood Rd SE
- 2702 Ivanhoe Ln SE
- 536 Powder Springs St SE
- 2730 Sherwood Rd SE
- 2739 Sherwood Rd SE
- 2730 Ivanhoe Ln SE
- 2720 Ivanhoe Ln SE
- 0 Ivanhoe Ln Unit 8455345
- 0 Ivanhoe Ln Unit 8420234
- 0 Ivanhoe Ln Unit 3169566