
Seller's Agent in 2026
Dena Furlow
Keller Williams Infinity
(630) 742-4374
1 in this area
232 Total Sales
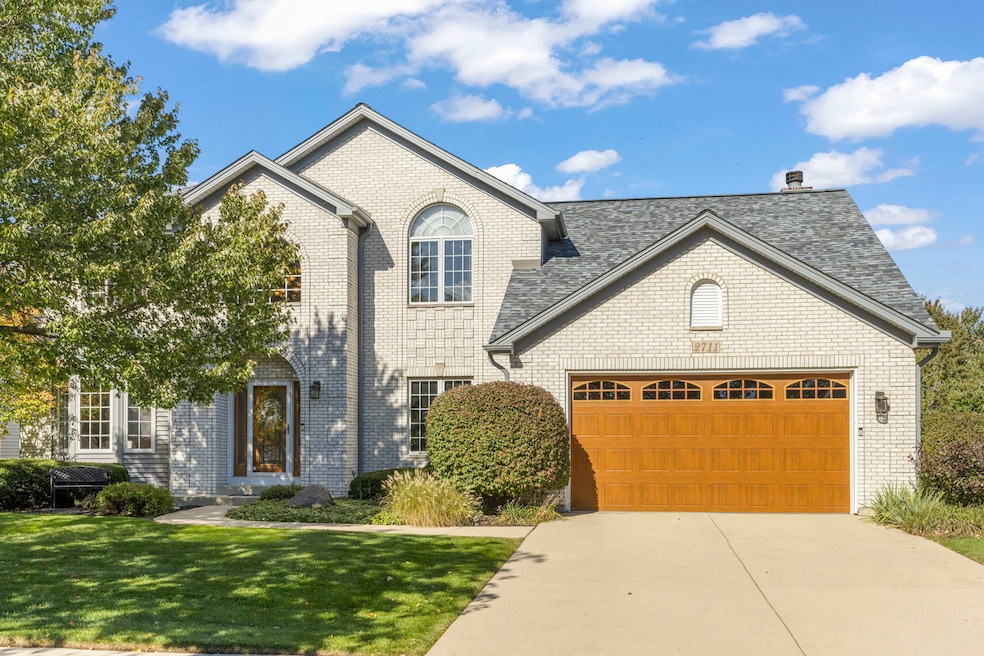


Welcome to Harmony Grove! This beautiful 5-bedroom, 3.1-bath home in Naperville's highly rated District 204 schools offers over 3,000 sq. ft. of living space plus a fully finished basement. Step into the inviting two-story foyer leading to formal living and dining rooms. The oversized family room features built-in shelves, a gas fireplace, and skylights that fill the space with natural light-perfect for everyday living and entertaining. A first-floor office and laundry room add everyday convenience. The updated kitchen boasts stainless steel appliances, granite countertops, abundant cabinet space, a large pantry, and an eating area with access to the cement patio and mature backyard. Upstairs, you'll find four spacious bedrooms-all with walk-in closets, ceiling fans, and tray ceilings. The primary suite features a cathedral ceiling, sitting area, and two walk-in closets. The luxury primary bath includes a double vanity, corner jet tub, dual walk-in shower, linen closet, and skylight, creating a bright and relaxing retreat. The finished basement adds even more living space with newer carpet, a large recreation room, game area, and separate storage. Spacious basement featuring a fully equipped kitchen, full bath, and a cozy bedroom - perfect for guests or multi-generational living. Additional highlights include a 3-year-old roof, new furnace (2024), newer windows, sprinkler system, invisible fence, electric car plug-in, water-operated sump pump backup, and water softener. The garage is extra-deep, offering additional storage, and includes an oversized side door-perfect for easily moving large items in and out. Located in the desirable Harmony Grove subdivision, this home is just minutes from Downtown Naperville, the scenic Riverwalk, and a variety of boutiques, restaurants, and entertainment options. Enjoy the perfect blend of comfort, convenience, and Naperville charm!
Last Agent to Sell the Property
Keller Williams Infinity Brokerage Phone: (630) 778-5800 License #471006891 Listed on: 10/28/2025
Co-Listed By
Keller Williams Infinity Brokerage Phone: (630) 778-5800 License #475176334
| Date | Type | Sale Price | Title Company |
|---|---|---|---|
| Deed | $762,000 | First American Title | |
| Quit Claim Deed | -- | None Listed On Document | |
| Warranty Deed | $300,500 | Chicago Title Insurance Co | |
| Warranty Deed | $71,000 | Chicago Title Insurance Co |
| Date | Status | Loan Amount | Loan Type |
|---|---|---|---|
| Open | $607,000 | New Conventional | |
| Previous Owner | $227,150 | No Value Available |
| Date | Event | Price | List to Sale | Price per Sq Ft |
|---|---|---|---|---|
| 01/05/2026 01/05/26 | Sold | $762,000 | -1.0% | $252 / Sq Ft |
| 11/12/2025 11/12/25 | Pending | -- | -- | -- |
| 10/28/2025 10/28/25 | For Sale | $769,900 | -- | $255 / Sq Ft |
| Year | Tax Paid | Tax Assessment Tax Assessment Total Assessment is a certain percentage of the fair market value that is determined by local assessors to be the total taxable value of land and additions on the property. | Land | Improvement |
|---|---|---|---|---|
| 2024 | $13,243 | $210,179 | $43,748 | $166,431 |
| 2023 | $13,243 | $185,671 | $38,647 | $147,024 |
| 2022 | $11,901 | $170,255 | $36,560 | $133,695 |
| 2021 | $11,374 | $162,148 | $34,819 | $127,329 |
| 2020 | $11,158 | $159,578 | $34,267 | $125,311 |
| 2019 | $10,966 | $155,080 | $33,301 | $121,779 |
| 2018 | $10,312 | $143,652 | $32,568 | $111,084 |
| 2017 | $11,623 | $159,341 | $31,727 | $127,614 |
| 2016 | $11,602 | $155,911 | $31,044 | $124,867 |
| 2015 | $11,501 | $149,914 | $29,850 | $120,064 |
| 2014 | $11,501 | $145,814 | $29,850 | $115,964 |
| 2013 | $11,501 | $145,814 | $29,850 | $115,964 |
Seller's Agent in 2026
Dena Furlow
Keller Williams Infinity
(630) 742-4374
1 in this area
232 Total Sales
Seller Co-Listing Agent in 2026
Christa Gates
Keller Williams Infinity
(630) 862-1260
1 in this area
44 Total Sales
Buyer's Agent in 2026
Ali Bagir
Coldwell Banker Realty
(847) 420-4843
1 in this area
36 Total Sales
Source: Midwest Real Estate Data (MRED)
MLS Number: 12497233
APN: 07-01-15-302-062
Disclaimer: Certain information contained herein is derived from information provided by parties other than Homes.com. All information provided is deemed reliable, but is not guaranteed to be accurate and should be independently verified.
![]() Based on information submitted to the MLS GRID. All data is obtained from various sources and may not have been verified by broker or MLS GRID. Supplied Open House Information is subject to change without notice. All information should be independently reviewed and verified for accuracy. Properties may or may not be listed by the office/agent presenting the information. Some IDX listings have been excluded from this website.
Based on information submitted to the MLS GRID. All data is obtained from various sources and may not have been verified by broker or MLS GRID. Supplied Open House Information is subject to change without notice. All information should be independently reviewed and verified for accuracy. Properties may or may not be listed by the office/agent presenting the information. Some IDX listings have been excluded from this website.
Based on information submitted to the MLS GRID
Ask me questions while you tour the home.