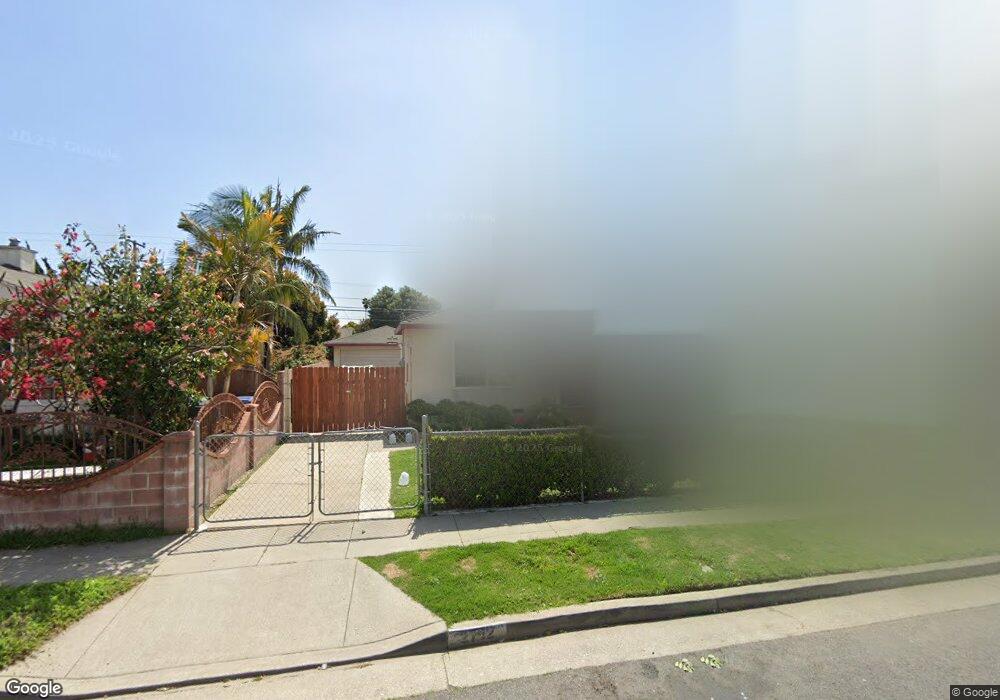
2712 E Tyler St Long Beach, CA 90810
Estimated Value: $714,000 - $762,000
3
Beds
2
Baths
1,278
Sq Ft
$570/Sq Ft
Est. Value
About This Home
This home is located at 2712 E Tyler St, Long Beach, CA 90810 and is currently estimated at $728,114, approximately $569 per square foot. 2712 E Tyler St is a home located in Los Angeles County with nearby schools including Dominguez Elementary School, Rancho Dominguez Preparatory School, and Pacific Baptist School.
Ownership History
Date
Name
Owned For
Owner Type
Purchase Details
Closed on
Jul 8, 2014
Sold by
Gayap Maria Fe M
Bought by
Gayap Maria Fe M and Maria Fe M Gayap Revocable Living Trust
Current Estimated Value
Purchase Details
Closed on
Jun 29, 2013
Sold by
Castro Lorna Balolong
Bought by
Gayap Maria Fe M
Purchase Details
Closed on
Jan 7, 2013
Sold by
Gayap Maria Fe M
Bought by
Biares Roberto B and Balolong Nelita F
Purchase Details
Closed on
Aug 20, 1999
Sold by
Topp Thomas N
Bought by
Gayap Percival M and Gayap Maria Fe M
Home Financials for this Owner
Home Financials are based on the most recent Mortgage that was taken out on this home.
Original Mortgage
$6,500
Interest Rate
7.97%
Purchase Details
Closed on
Jul 31, 1997
Sold by
Topp Thomas N
Bought by
Topp Thomas Neil and Topp Sanjose Margaret
Create a Home Valuation Report for This Property
The Home Valuation Report is an in-depth analysis detailing your home's value as well as a comparison with similar homes in the area
Home Values in the Area
Average Home Value in this Area
Purchase History
| Date | Buyer | Sale Price | Title Company |
|---|---|---|---|
| Gayap Maria Fe M | -- | None Available | |
| Gayap Maria Fe M | -- | None Available | |
| Gayap Maria Fe M | -- | None Available | |
| Biares Roberto B | -- | None Available | |
| Gayap Percival M | $130,000 | North American Title Co | |
| Topp Thomas Neil | -- | -- |
Source: Public Records
Mortgage History
| Date | Status | Borrower | Loan Amount |
|---|---|---|---|
| Previous Owner | Gayap Percival M | $6,500 | |
| Closed | Gayap Percival M | $123,500 |
Source: Public Records
Tax History
| Year | Tax Paid | Tax Assessment Tax Assessment Total Assessment is a certain percentage of the fair market value that is determined by local assessors to be the total taxable value of land and additions on the property. | Land | Improvement |
|---|---|---|---|---|
| 2025 | $3,944 | $257,421 | $122,581 | $134,840 |
| 2024 | $3,944 | $252,375 | $120,178 | $132,197 |
| 2023 | $3,863 | $247,427 | $117,822 | $129,605 |
| 2022 | $3,680 | $242,576 | $115,512 | $127,064 |
| 2021 | $3,633 | $237,821 | $113,248 | $124,573 |
| 2019 | $3,497 | $230,769 | $109,890 | $120,879 |
| 2018 | $3,386 | $226,245 | $107,736 | $118,509 |
| 2016 | $3,243 | $217,461 | $103,553 | $113,908 |
| 2015 | $3,174 | $214,195 | $101,998 | $112,197 |
| 2014 | $3,168 | $210,000 | $100,000 | $110,000 |
Source: Public Records
Map
Nearby Homes
- 2709 E Van Buren St
- 2650 E Dominguez St
- 2871 E Tyler St
- 2548 E Washington St
- 4693 Holly Ave
- 4220 N Virginia Vista
- 4750 Holly Ave
- 3661 Seabright Ave
- 630 W Devon Place
- 4125 Del Mar Ave
- 4925 Holly Ave
- 627 Avery Place
- 1924 W Arlington St
- 4813 Pacific Ave
- 1879 E Cyrene Dr
- 3595 Santa fe Ave Unit 73
- 3595 Santa fe Ave Unit 19
- 3595 Santa fe Ave Unit 291
- 3595 Santa fe Ave Unit 162
- 3595 Santa fe Ave Unit 26
- 2708 E Tyler St
- 2716 E Tyler St
- 2706 E Tyler St
- 2720 E Tyler St
- 2704 E Tyler St
- 2713 E Harrison St
- 2709 E Harrison St
- 2717 E Harrison St
- 2726 E Tyler St
- 2705 E Harrison St
- 21108 S Prospect Ave
- 2702 E Tyler St
- 2721 E Harrison St
- 2713 E Tyler St
- 2715 E Tyler St
- 2709 E Tyler St
- 21114 S Prospect Ave
- 2719 E Tyler St
- 2707 E Tyler St
- 2727 E Harrison St
Your Personal Tour Guide
Ask me questions while you tour the home.