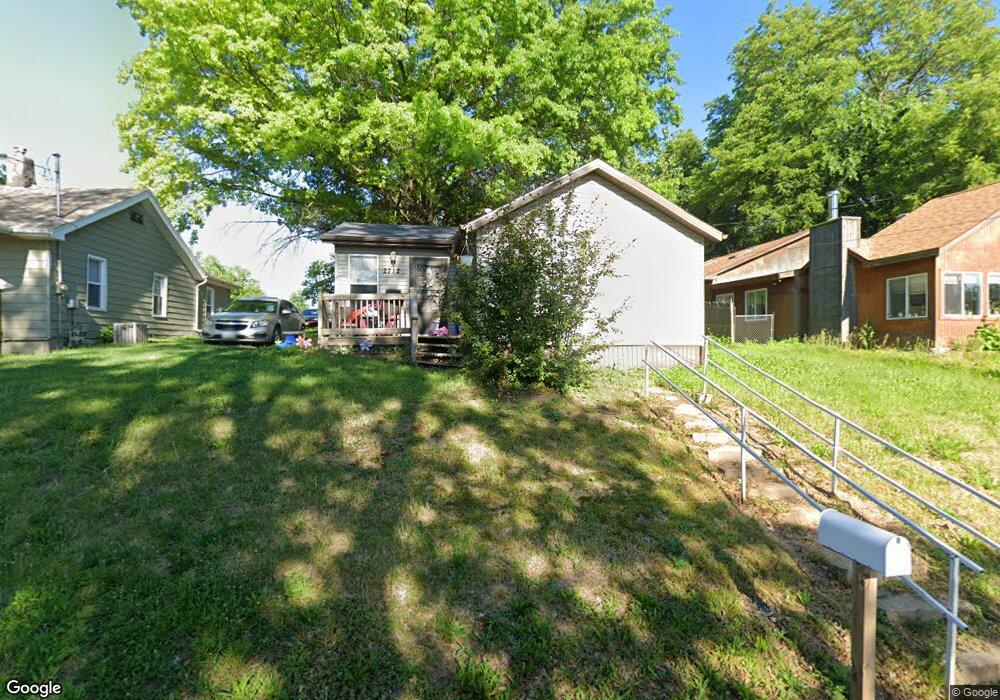
2712 SE 8th Ct Des Moines, IA 50315
Indianola Hills NeighborhoodEstimated Value: $132,000 - $156,000
2
Beds
1
Bath
832
Sq Ft
$172/Sq Ft
Est. Value
About This Home
This home is located at 2712 SE 8th Ct, Des Moines, IA 50315 and is currently estimated at $142,933, approximately $171 per square foot. 2712 SE 8th Ct is a home located in Polk County with nearby schools including Howe Elementary School, Weeks Middle School, and Lincoln High School.
Ownership History
Date
Name
Owned For
Owner Type
Purchase Details
Closed on
Feb 15, 2008
Sold by
Hsbc Bank Usa Na
Bought by
Andreini Ryan R
Current Estimated Value
Purchase Details
Closed on
Apr 9, 2006
Sold by
Mouzakis Henry and Mouzakis Judy
Bought by
2712 Se 8Th Ct Trust and Ferguson D W
Purchase Details
Closed on
Jan 17, 2005
Sold by
Lewis Billy C
Bought by
Mouzakis Henry and Mouzakis Judy
Home Financials for this Owner
Home Financials are based on the most recent Mortgage that was taken out on this home.
Original Mortgage
$24,166
Interest Rate
5.83%
Mortgage Type
Unknown
Purchase Details
Closed on
Mar 16, 2000
Sold by
Powell Richard O and Powell Beatrice E
Bought by
Lewis Billy C
Home Financials for this Owner
Home Financials are based on the most recent Mortgage that was taken out on this home.
Original Mortgage
$9,419
Interest Rate
10%
Mortgage Type
Seller Take Back
Create a Home Valuation Report for This Property
The Home Valuation Report is an in-depth analysis detailing your home's value as well as a comparison with similar homes in the area
Home Values in the Area
Average Home Value in this Area
Purchase History
| Date | Buyer | Sale Price | Title Company |
|---|---|---|---|
| Andreini Ryan R | $13,500 | None Available | |
| 2712 Se 8Th Ct Trust | -- | None Available | |
| Mouzakis Henry | $9,500 | -- | |
| Lewis Billy C | $9,500 | None Available | |
| Lewis Billy C | $9,419 | -- |
Source: Public Records
Mortgage History
| Date | Status | Borrower | Loan Amount |
|---|---|---|---|
| Previous Owner | Mouzakis Henry | $24,166 | |
| Previous Owner | Lewis Billy C | $24,166 | |
| Previous Owner | Lewis Billy C | $9,419 |
Source: Public Records
Tax History
| Year | Tax Paid | Tax Assessment Tax Assessment Total Assessment is a certain percentage of the fair market value that is determined by local assessors to be the total taxable value of land and additions on the property. | Land | Improvement |
|---|---|---|---|---|
| 2025 | $1,566 | $93,700 | $18,600 | $75,100 |
| 2024 | $1,566 | $79,600 | $15,600 | $64,000 |
| 2023 | $1,640 | $79,600 | $15,600 | $64,000 |
| 2022 | $1,628 | $69,600 | $13,700 | $55,900 |
| 2021 | $1,534 | $69,600 | $13,700 | $55,900 |
| 2020 | $1,594 | $61,500 | $12,000 | $49,500 |
| 2019 | $912 | $61,500 | $12,000 | $49,500 |
| 2018 | $902 | $56,900 | $10,900 | $46,000 |
| 2017 | $836 | $56,900 | $10,900 | $46,000 |
| 2016 | $814 | $53,900 | $10,100 | $43,800 |
| 2015 | $814 | $53,900 | $10,100 | $43,800 |
| 2014 | $750 | $51,200 | $9,500 | $41,700 |
Source: Public Records
Map
Nearby Homes
- 2505 SE 8th St
- 2830 SE 7th St
- 2519 SE 6th St
- 2528 SE 6th St
- 608 E Virginia Ave
- 2413 SE 8th St
- 2503 SE 5th St
- 2825 SE 14th St Unit 40
- 2825 SE 14th St Unit 33
- 2825 SE 14th St Unit 58
- 2825 SE 14th St Unit 23
- 2825 SE 14th St Unit 28
- 2420 SE 6th St
- 3136 SE 8th St
- 407 E Creston Ave
- 1440 E Glenwood Dr
- 336 E Broad St
- 3140 SE 5th St
- 352 E Pleasant View Dr
- 323 E Broad St
Your Personal Tour Guide
Ask me questions while you tour the home.