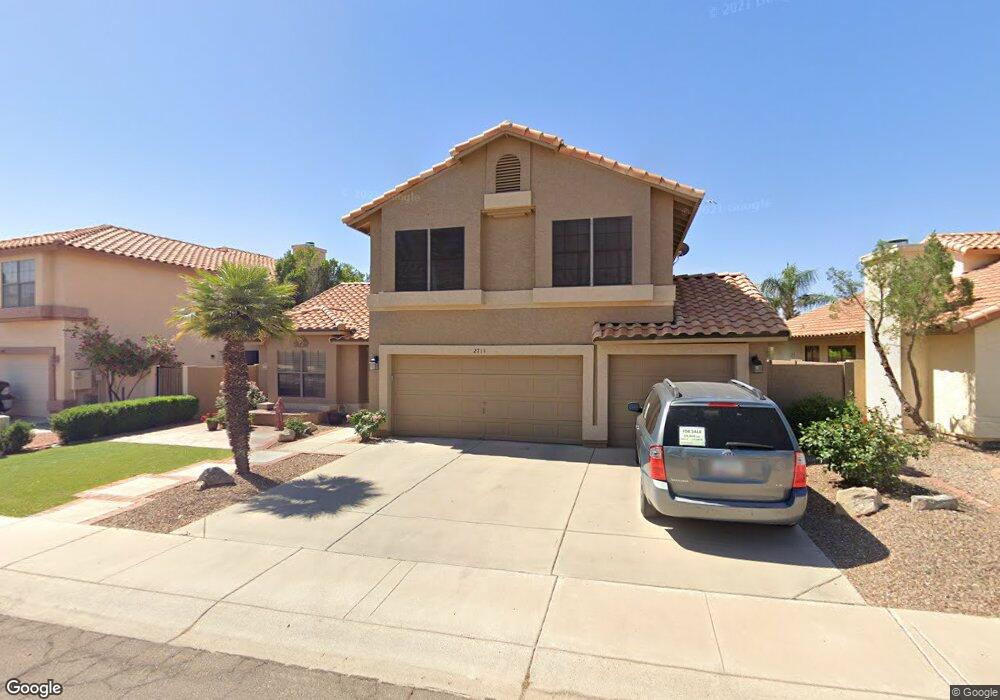
2713 E Cathedral Rock Dr Phoenix, AZ 85048
Ahwatukee NeighborhoodEstimated Value: $496,455 - $616,000
Studio
3
Baths
2,231
Sq Ft
$255/Sq Ft
Est. Value
About This Home
This home is located at 2713 E Cathedral Rock Dr, Phoenix, AZ 85048 and is currently estimated at $569,864, approximately $255 per square foot. 2713 E Cathedral Rock Dr is a home located in Maricopa County with nearby schools including Kyrene Monte Vista Elementary School, Kyrene Altadeña Middle School, and Desert Vista High School.
Ownership History
Date
Name
Owned For
Owner Type
Purchase Details
Closed on
Apr 19, 2011
Sold by
Tighe James F and Tighe Jennifer A
Bought by
Tighe James Frederik and Tighe Jennifer Ann
Current Estimated Value
Purchase Details
Closed on
Sep 19, 1997
Sold by
Jones Daniel Lee and Jones Dan L
Bought by
Tighe James F and Tighe Jennifer A
Home Financials for this Owner
Home Financials are based on the most recent Mortgage that was taken out on this home.
Original Mortgage
$148,500
Interest Rate
7.36%
Mortgage Type
New Conventional
Purchase Details
Closed on
May 13, 1997
Sold by
Jones Dana A and Jones Dana Ann
Bought by
Jones Dan L and Jones Daniel Lee
Purchase Details
Closed on
Aug 10, 1994
Sold by
Manucci Dan J and Manucci Loucile T
Bought by
Jones Daniel Lee and Jones Dana Ann
Home Financials for this Owner
Home Financials are based on the most recent Mortgage that was taken out on this home.
Original Mortgage
$134,900
Interest Rate
8.37%
Mortgage Type
New Conventional
Create a Home Valuation Report for This Property
The Home Valuation Report is an in-depth analysis detailing your home's value as well as a comparison with similar homes in the area
Home Values in the Area
Average Home Value in this Area
Purchase History
| Date | Buyer | Sale Price | Title Company |
|---|---|---|---|
| Tighe James Frederik | -- | None Available | |
| Tighe James F | $165,000 | Stewart Title & Trust | |
| Jones Dan L | -- | Stewart Title & Trust | |
| Jones Daniel Lee | $142,000 | Security Title Agency |
Source: Public Records
Mortgage History
| Date | Status | Borrower | Loan Amount |
|---|---|---|---|
| Closed | Tighe James F | $148,500 | |
| Previous Owner | Jones Daniel Lee | $134,900 |
Source: Public Records
Tax History
| Year | Tax Paid | Tax Assessment Tax Assessment Total Assessment is a certain percentage of the fair market value that is determined by local assessors to be the total taxable value of land and additions on the property. | Land | Improvement |
|---|---|---|---|---|
| 2025 | $2,666 | $29,744 | -- | -- |
| 2024 | $2,538 | $28,328 | -- | -- |
| 2023 | $2,538 | $40,130 | $8,020 | $32,110 |
| 2022 | $2,417 | $31,120 | $6,220 | $24,900 |
| 2021 | $2,521 | $28,680 | $5,730 | $22,950 |
| 2020 | $2,458 | $27,420 | $5,480 | $21,940 |
| 2019 | $2,380 | $25,720 | $5,140 | $20,580 |
| 2018 | $2,299 | $24,680 | $4,930 | $19,750 |
| 2017 | $2,194 | $24,300 | $4,860 | $19,440 |
| 2016 | $2,223 | $24,200 | $4,840 | $19,360 |
| 2015 | $1,990 | $22,410 | $4,480 | $17,930 |
Source: Public Records
Map
Nearby Homes
- 2702 E Cathedral Rock Dr
- 2710 E Rock Wren Rd
- 2750 E Rock Wren Rd
- 2647 E South Fork Dr
- 2639 E Verbena Dr
- 14844 S 27th Way Unit 37C
- 2747 E Desert Trumpet Rd
- 2451 E Indigo Brush Rd
- 2916 E Amber Ridge Way
- 2451 E Dry Creek Rd
- 3115 E Bighorn Ave
- 14644 S 24th Place
- 2630 E Silverwood Dr
- 2919 E Muirwood Dr
- 3236 E Chandler Blvd Unit 3031
- 3236 E Chandler Blvd Unit 1082
- 0 S Xxxx -- Unit 6971190
- 15802 S 32nd Place
- 15431 S 22nd St
- 14012 S Canyon Dr Unit 20
- 2705 E Cathedral Rock Dr
- 2719 E Cathedral Rock Dr
- 2708 E Mountain Sky Ave
- 2725 E Cathedral Rock Dr
- 2701 E Cathedral Rock Dr
- 2714 E Mountain Sky Ave
- 2702 E Mountain Sky Ave
- 2710 E Cathedral Rock Dr
- 2716 E Cathedral Rock Dr
- 2706 E Cathedral Rock Dr
- 2718 E Mountain Sky Ave
- 2731 E Cathedral Rock Dr
- 2720 E Cathedral Rock Dr
- 2726 E Cathedral Rock Dr Unit 37
- 2735 E Cathedral Rock Dr
- 2724 E Mountain Sky Ave
- 2713 E Mountain Sky Ave
- 2732 E Cathedral Rock Dr
- 2709 E Thunderhill Place
- 2707 E Mountain Sky Ave Unit 37A
Your Personal Tour Guide
Ask me questions while you tour the home.