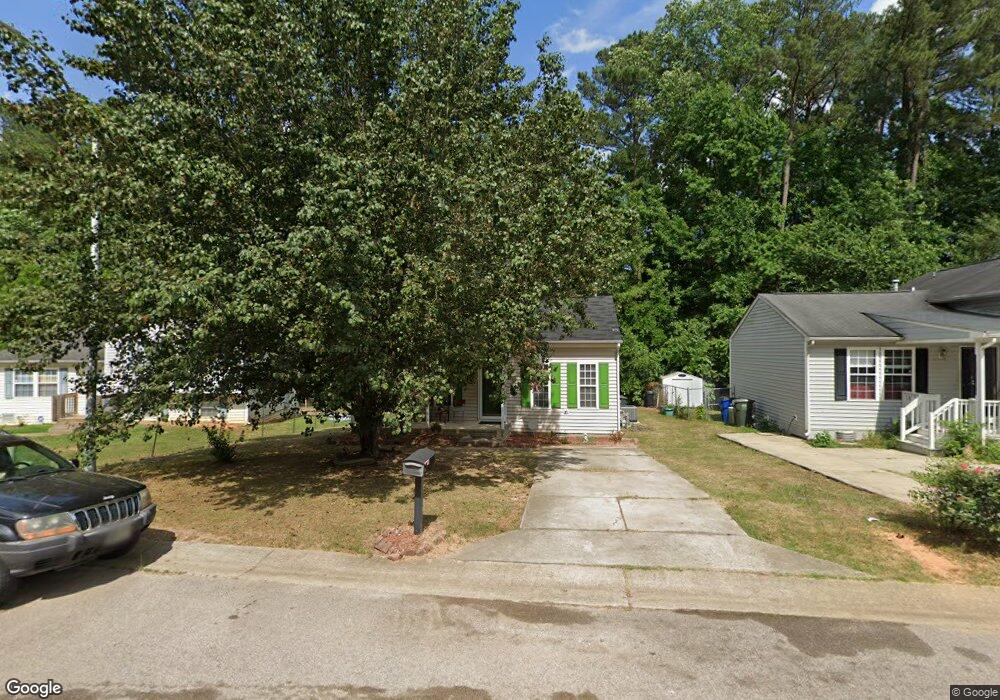
2713 Midway Park Ct Raleigh, NC 27610
South Raleigh NeighborhoodEstimated Value: $263,000 - $277,126
3
Beds
2
Baths
1,172
Sq Ft
$229/Sq Ft
Est. Value
About This Home
This home is located at 2713 Midway Park Ct, Raleigh, NC 27610 and is currently estimated at $268,782, approximately $229 per square foot. 2713 Midway Park Ct is a home located in Wake County with nearby schools including Walnut Creek Elementary School, Carnage Magnet Middle School, and Southeast Raleigh Magnet High School.
Ownership History
Date
Name
Owned For
Owner Type
Purchase Details
Closed on
Feb 28, 2006
Sold by
Anderson James E and Anderson Juanita H
Bought by
Cummings Timothy G
Current Estimated Value
Home Financials for this Owner
Home Financials are based on the most recent Mortgage that was taken out on this home.
Original Mortgage
$111,984
Outstanding Balance
$62,802
Interest Rate
6.04%
Mortgage Type
FHA
Estimated Equity
$205,980
Purchase Details
Closed on
Dec 8, 2005
Sold by
Anderson James Edward and Anderson Dorcas Jeanette
Bought by
Hansen Patricia J and Estate Of Jacquelyn Ann Anderson
Purchase Details
Closed on
Feb 22, 2000
Sold by
Anderson Homes Inc
Bought by
Anderson James E and Anderson Juanita H
Home Financials for this Owner
Home Financials are based on the most recent Mortgage that was taken out on this home.
Original Mortgage
$107,976
Interest Rate
8.29%
Mortgage Type
FHA
Purchase Details
Closed on
Jan 18, 2000
Sold by
Homlen Enterprises Llc
Bought by
Anderson Homes Inc
Home Financials for this Owner
Home Financials are based on the most recent Mortgage that was taken out on this home.
Original Mortgage
$107,976
Interest Rate
8.29%
Mortgage Type
FHA
Create a Home Valuation Report for This Property
The Home Valuation Report is an in-depth analysis detailing your home's value as well as a comparison with similar homes in the area
Home Values in the Area
Average Home Value in this Area
Purchase History
| Date | Buyer | Sale Price | Title Company |
|---|---|---|---|
| Cummings Timothy G | $114,000 | None Available | |
| Hansen Patricia J | -- | None Available | |
| Anderson James E | $108,500 | -- | |
| Anderson Homes Inc | $18,500 | -- |
Source: Public Records
Mortgage History
| Date | Status | Borrower | Loan Amount |
|---|---|---|---|
| Open | Cummings Timothy G | $111,984 | |
| Previous Owner | Anderson James E | $107,976 |
Source: Public Records
Tax History Compared to Growth
Tax History
| Year | Tax Paid | Tax Assessment Tax Assessment Total Assessment is a certain percentage of the fair market value that is determined by local assessors to be the total taxable value of land and additions on the property. | Land | Improvement |
|---|---|---|---|---|
| 2025 | $2,553 | $290,460 | $110,000 | $180,460 |
| 2024 | $2,543 | $290,460 | $110,000 | $180,460 |
| 2023 | $1,752 | $158,927 | $36,000 | $122,927 |
| 2022 | $1,629 | $158,927 | $36,000 | $122,927 |
| 2021 | $1,566 | $158,927 | $36,000 | $122,927 |
| 2020 | $1,538 | $158,927 | $36,000 | $122,927 |
| 2019 | $1,285 | $109,159 | $26,000 | $83,159 |
| 2018 | $1,213 | $109,159 | $26,000 | $83,159 |
| 2017 | $1,156 | $109,159 | $26,000 | $83,159 |
| 2016 | $1,132 | $109,159 | $26,000 | $83,159 |
| 2015 | $1,220 | $115,920 | $32,000 | $83,920 |
| 2014 | $1,158 | $115,920 | $32,000 | $83,920 |
Source: Public Records
Map
Nearby Homes
- 1725 Fox Hollow Dr
- 2908 Basswood Dr
- 2200 Sanderford Rd
- 1416 Oakhill Ct
- 2801 Quince Dr
- 1200 Hazelnut Dr
- 1200 Armstrong Cir
- 3221 Snowberry Dr
- 2816 Smoke Place
- 3204 Winfield Ct
- 1316 Foxrun Dr
- 3140 Slippery Elm Dr
- 3405 Mogollon Ct
- 3305 Paschall Ct
- 3208 Tradewind Ct
- 2109 Star Sapphire Dr
- 2809 Newark Dr
- 2400 Keith Dr
- 2025 Atkins Dr
- 1445 Lombar St
- 2717 Midway Park Ct
- 2709 Midway Park Ct
- 2721 Midway Park Ct
- 2705 Midway Park Ct
- 2608 Adcox Place
- 2604 Adcox Place
- 2725 Midway Park Ct
- 2612 Adcox Place
- 2701 Midway Park Ct
- 2716 Midway Park Ct
- 2712 Midway Park Ct
- 2600 Adcox Place
- 2720 Midway Park Ct
- 2616 Adcox Place
- 2700 Midway Park Ct
- 2729 Midway Park Ct
- 2704 Midway Park Ct
- 2728 Midway Park Ct
- 2620 Adcox Place
- 2732 Midway Park Ct