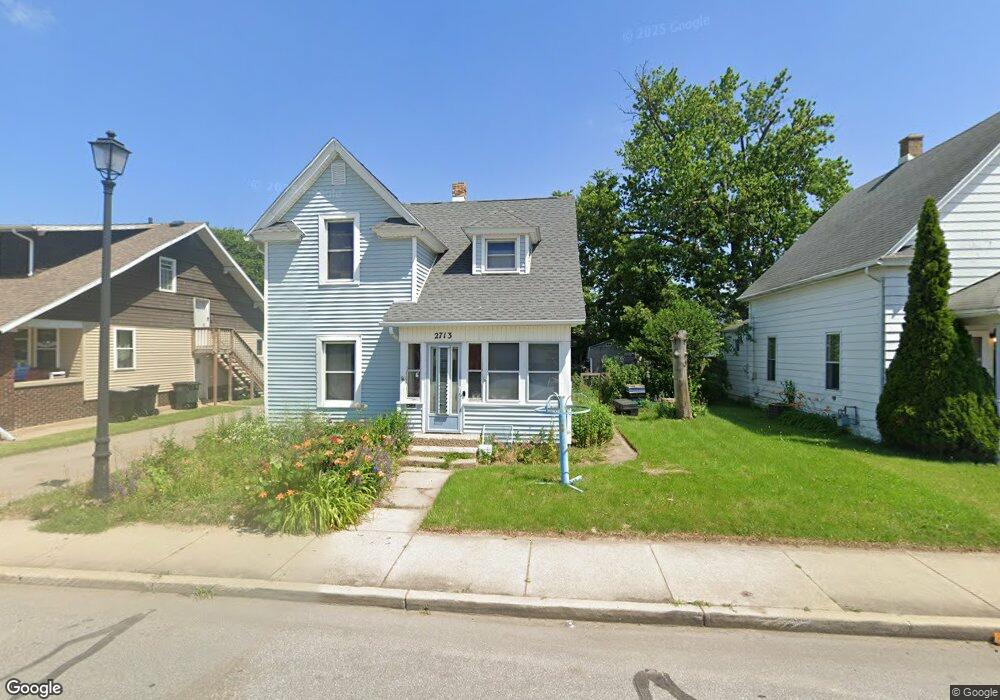
2713 Mishawaka Ave South Bend, IN 46615
River Park NeighborhoodEstimated Value: $135,000 - $168,000
3
Beds
2
Baths
1,296
Sq Ft
$118/Sq Ft
Est. Value
About This Home
This home is located at 2713 Mishawaka Ave, South Bend, IN 46615 and is currently estimated at $152,360, approximately $117 per square foot. 2713 Mishawaka Ave is a home located in St. Joseph County with nearby schools including Cora B. Darling Elementary School, Nuner Fine Arts Academy, and Clay Intermediate Center.
Ownership History
Date
Name
Owned For
Owner Type
Purchase Details
Closed on
May 21, 2021
Sold by
Earl K Morgan And Nannie L Morgan Family and Morgan Gary A
Bought by
Morgan Gary A and Morgan Eugene K
Current Estimated Value
Purchase Details
Closed on
May 3, 2021
Sold by
Morgan Gary A and Morgan Eugene K
Bought by
Peters Danny Eugene
Create a Home Valuation Report for This Property
The Home Valuation Report is an in-depth analysis detailing your home's value as well as a comparison with similar homes in the area
Home Values in the Area
Average Home Value in this Area
Purchase History
| Date | Buyer | Sale Price | Title Company |
|---|---|---|---|
| Morgan Gary A | -- | None Listed On Document | |
| Peters Danny Eugene | -- | None Listed On Document | |
| Peters Danny Eugene | -- | None Available | |
| Morgan Gary A | -- | None Available | |
| Morgan Gary A | -- | None Available | |
| Peters Danny Eugene | -- | None Available |
Source: Public Records
Tax History Compared to Growth
Tax History
| Year | Tax Paid | Tax Assessment Tax Assessment Total Assessment is a certain percentage of the fair market value that is determined by local assessors to be the total taxable value of land and additions on the property. | Land | Improvement |
|---|---|---|---|---|
| 2024 | $1,349 | $114,900 | $5,900 | $109,000 |
| 2023 | $1,306 | $104,100 | $5,900 | $98,200 |
| 2022 | $1,104 | $86,200 | $5,900 | $80,300 |
| 2021 | $152 | $77,900 | $3,800 | $74,100 |
| 2020 | $149 | $66,700 | $3,300 | $63,400 |
| 2019 | $165 | $74,800 | $2,600 | $72,200 |
| 2018 | $287 | $64,200 | $2,300 | $61,900 |
| 2017 | $140 | $59,400 | $2,300 | $57,100 |
| 2016 | $139 | $59,400 | $2,300 | $57,100 |
| 2014 | $101 | $58,600 | $2,300 | $56,300 |
Source: Public Records
Map
Nearby Homes
- 806 S 26th St
- 815 S 26th St
- 1111 S 27th St
- 634 S 26th St
- 537 S 27th St
- 525 S 28th St
- 1017 S 23rd St
- 513 S 26th St
- 3312 Mishawaka Ave
- 734 S 33rd St
- 930 S 34th St
- 510 S Ironwood Dr
- 715 S 35th St
- 1229 S 34th St
- 1105 S 35th St
- 137 Monmoor Ave
- 3517 Mishawaka Ave
- 741 S 36th St
- 3401 Northside Blvd
- 3312 E Jefferson Square
- 2717 Mishawaka Ave
- 2709 Mishawaka Ave
- 845 S 28th St
- 2705 Mishawaka Ave
- 843 S 28th St
- 2701 Mishawaka Ave
- 842 S 27th St
- 837 S 28th St
- 838 S 27th St
- 2801 Mishawaka Ave
- 833 S 28th St
- 834 S 27th St
- 2805 Mishawaka Ave
- 831 S 28th St
- 845 S 27th St
- 844 S 28th St
- 2720 Mishawaka Ave
- 2621 E Mishawaka Ave
- 2809 Mishawaka Ave
- 840 S 28th St