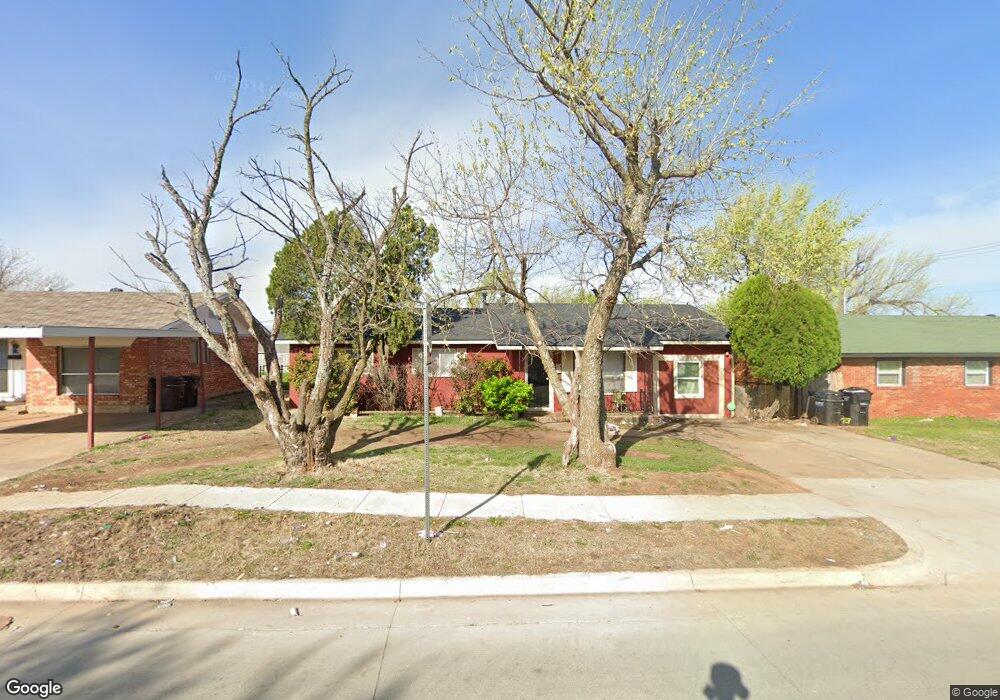
2713 N Nottingham Way Moore, OK 73160
Regency Park NeighborhoodEstimated Value: $146,000 - $156,000
5
Beds
2
Baths
1,478
Sq Ft
$101/Sq Ft
Est. Value
About This Home
This home is located at 2713 N Nottingham Way, Moore, OK 73160 and is currently estimated at $149,046, approximately $100 per square foot. 2713 N Nottingham Way is a home located in Cleveland County with nearby schools including Houchin Elementary School, Highland West Junior High School, and Southmoore High School.
Ownership History
Date
Name
Owned For
Owner Type
Purchase Details
Closed on
Jul 18, 2022
Sold by
Valdez Barbara J
Bought by
Legacy Investment Holdings Llc
Current Estimated Value
Home Financials for this Owner
Home Financials are based on the most recent Mortgage that was taken out on this home.
Original Mortgage
$112,500
Interest Rate
5.09%
Mortgage Type
Construction
Purchase Details
Closed on
Jun 13, 2014
Sold by
Benshoof Brent A
Bought by
Valdez Barbara J
Home Financials for this Owner
Home Financials are based on the most recent Mortgage that was taken out on this home.
Original Mortgage
$57,488
Interest Rate
4.27%
Mortgage Type
FHA
Purchase Details
Closed on
Aug 13, 2012
Sold by
Benshoof Kay S
Bought by
Benshoof Kay S and Kay S Benshoof Revocable Trust
Create a Home Valuation Report for This Property
The Home Valuation Report is an in-depth analysis detailing your home's value as well as a comparison with similar homes in the area
Home Values in the Area
Average Home Value in this Area
Purchase History
| Date | Buyer | Sale Price | Title Company |
|---|---|---|---|
| Legacy Investment Holdings Llc | $121,500 | American Security Title | |
| Valdez Barbara J | $64,000 | Stewart Abstract & Title Of | |
| Benshoof Kay S | -- | None Available |
Source: Public Records
Mortgage History
| Date | Status | Borrower | Loan Amount |
|---|---|---|---|
| Closed | Legacy Investment Holdings Llc | $112,500 | |
| Previous Owner | Valdez Barbara J | $57,488 |
Source: Public Records
Tax History
| Year | Tax Paid | Tax Assessment Tax Assessment Total Assessment is a certain percentage of the fair market value that is determined by local assessors to be the total taxable value of land and additions on the property. | Land | Improvement |
|---|---|---|---|---|
| 2025 | $1,957 | $15,985 | $3,359 | $12,626 |
| 2023 | $1,766 | $14,499 | $3,622 | $10,877 |
| 2022 | $1,226 | $9,909 | $2,781 | $7,128 |
| 2021 | $1,173 | $9,437 | $2,740 | $6,697 |
| 2020 | $1,117 | $8,988 | $1,920 | $7,068 |
| 2019 | $1,138 | $8,988 | $1,920 | $7,068 |
| 2018 | $1,138 | $8,988 | $1,920 | $7,068 |
| 2017 | $1,144 | $8,988 | $0 | $0 |
| 2016 | $1,152 | $8,988 | $1,920 | $7,068 |
| 2015 | $1,043 | $8,988 | $1,920 | $7,068 |
| 2014 | $788 | $7,634 | $957 | $6,677 |
Source: Public Records
Map
Nearby Homes
- 2704 Yorkshire Ave
- 2512 Yorkshire Ave
- 912 NW 24th St
- 2404 Piccadilly Cir
- 2401 Piccadilly Cir
- 3001 Prairie Field Ln
- 929 NW 20th St
- 825 NW 34th St
- 941 NW 32nd St
- 704 NW 21st St
- 1035 NW 20th St
- 624 NW 21st St
- 1725 Queensbury Rd
- 644 NW 20th St
- 4 SW 98th St
- 505 Cass Ave
- 0 NE 27th St
- 936 NW 15th St
- 785 NW 16th St
- 1837 City Ave
- 2709 N Nottingham Way
- 2717 N Nottingham Way
- 2705 N Nottingham Way
- 2712 Yorkshire Ave
- 908 NW 27th St
- 2708 Yorkshire Ave
- 2701 N Nottingham Way
- 2700 Yorkshire Ave
- 2613 N Nottingham Way
- 901 NW 27th St
- 837 NW 27th St
- 909 NW 27th St
- 2713 Yorkshire Ave
- 2709 Yorkshire Ave
- 2612 Yorkshire Ave
- 913 NW 27th St
- 2805 N Nottingham Way
- 2705 Yorkshire Ave
- 920 NW 27th St
- 2609 N Nottingham Way
Your Personal Tour Guide
Ask me questions while you tour the home.