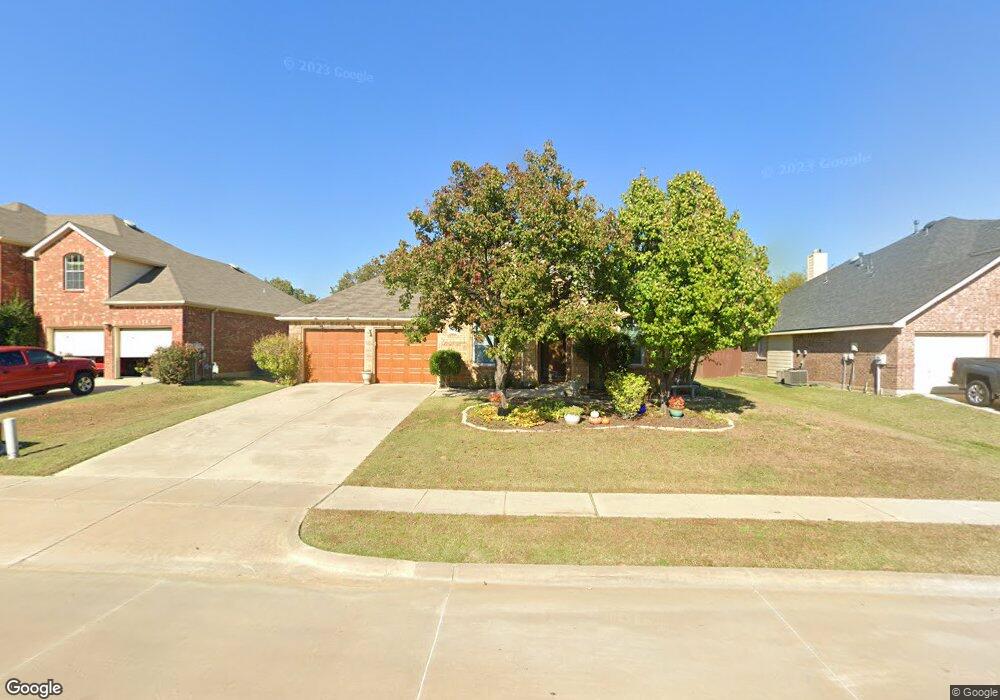
2713 Valencia Ln Denton, TX 76210
South Denton NeighborhoodEstimated Value: $398,429 - $423,000
4
Beds
2
Baths
2,362
Sq Ft
$174/Sq Ft
Est. Value
About This Home
This home is located at 2713 Valencia Ln, Denton, TX 76210 and is currently estimated at $411,357, approximately $174 per square foot. 2713 Valencia Ln is a home located in Denton County with nearby schools including Houston Elementary School, McMath Middle School, and Denton High School.
Ownership History
Date
Name
Owned For
Owner Type
Purchase Details
Closed on
May 16, 2019
Sold by
Breckenridge Property Fund 2016 Llc
Bought by
Trachsel Andrew J and Trachsel Kirsten M
Current Estimated Value
Home Financials for this Owner
Home Financials are based on the most recent Mortgage that was taken out on this home.
Original Mortgage
$209,850
Outstanding Balance
$182,967
Interest Rate
4%
Mortgage Type
New Conventional
Estimated Equity
$228,390
Purchase Details
Closed on
Jun 10, 2018
Sold by
Pasche Heather M and Pasche Richard T
Bought by
Breckenridge Property Fund 2016 Llc
Purchase Details
Closed on
Sep 5, 2002
Sold by
Lennar Homes Of Texas Land & Const Ltd
Bought by
Lennar Homes Of Texas Inc
Home Financials for this Owner
Home Financials are based on the most recent Mortgage that was taken out on this home.
Original Mortgage
$148,164
Interest Rate
6.41%
Mortgage Type
FHA
Create a Home Valuation Report for This Property
The Home Valuation Report is an in-depth analysis detailing your home's value as well as a comparison with similar homes in the area
Home Values in the Area
Average Home Value in this Area
Purchase History
| Date | Buyer | Sale Price | Title Company |
|---|---|---|---|
| Trachsel Andrew J | -- | Fidelity National Title | |
| Breckenridge Property Fund 2016 Llc | $188,000 | None Available | |
| Lennar Homes Of Texas Inc | -- | -- | |
| Lennar Homes Of Texas Inc | -- | -- | |
| Pasche Heather M | -- | -- |
Source: Public Records
Mortgage History
| Date | Status | Borrower | Loan Amount |
|---|---|---|---|
| Open | Trachsel Andrew J | $209,850 | |
| Previous Owner | Pasche Heather M | $148,164 |
Source: Public Records
Tax History Compared to Growth
Tax History
| Year | Tax Paid | Tax Assessment Tax Assessment Total Assessment is a certain percentage of the fair market value that is determined by local assessors to be the total taxable value of land and additions on the property. | Land | Improvement |
|---|---|---|---|---|
| 2025 | $6,003 | $410,265 | $76,038 | $335,968 |
| 2024 | $7,199 | $372,968 | $0 | $0 |
| 2023 | $5,277 | $339,062 | $76,038 | $331,497 |
| 2022 | $6,543 | $308,238 | $76,038 | $267,919 |
| 2021 | $6,229 | $280,216 | $59,508 | $220,708 |
| 2020 | $5,948 | $260,219 | $59,508 | $200,711 |
| 2019 | $6,110 | $256,073 | $59,508 | $196,565 |
| 2018 | $5,936 | $245,722 | $59,508 | $186,214 |
| 2017 | $5,571 | $225,376 | $59,508 | $165,868 |
| 2016 | $5,234 | $211,761 | $39,672 | $172,089 |
| 2015 | $4,521 | $190,294 | $39,672 | $150,622 |
| 2014 | $4,521 | $180,710 | $39,672 | $141,038 |
| 2013 | -- | $173,440 | $39,672 | $133,768 |
Source: Public Records
Map
Nearby Homes
- 2501 Great Bear Ln
- 2409 Loon Lake Rd
- 2312 Caddo Cir
- 2600 Pioneer Dr
- 2505 Pioneer Dr
- 2508 Pioneer Dr
- 2713 Clubhouse Dr
- 2544 Natchez Trace
- 2209 Loon Lake Rd
- 2544 Richmond Ct
- 2601 Pinto Dr
- 2913 Montebello Dr
- 2917 Montebello Dr
- 3428 Tuscan Hills Cir
- 2009 Lake Fork Ct
- 3009 Montebello Dr
- 2721 Arabian Ave
- 3448 Tuscan Hills Cir
- 3432 Sundown Blvd
- 2000 Lamprey Cir
- 2717 Valencia Ln
- 2709 Valencia Ln
- 2801 Valencia Ln
- 2705 Valencia Ln
- 3100 Waterton Cir
- 3101 Waterton Cir
- 3101 Widgeon Ln
- 2805 Valencia Ln
- 2701 Valencia Ln
- 3104 Waterton Cir
- 3105 Widgeon Ln
- 2809 Valencia Ln
- 2633 Valencia Ln
- 3105 Waterton Cir
- 3108 Waterton Cir
- 3109 Widgeon Ln
- 2813 Valencia Ln
- 2632 Valencia Ln
- 3104 Union Lake Rd
- 3112 Waterton Cir