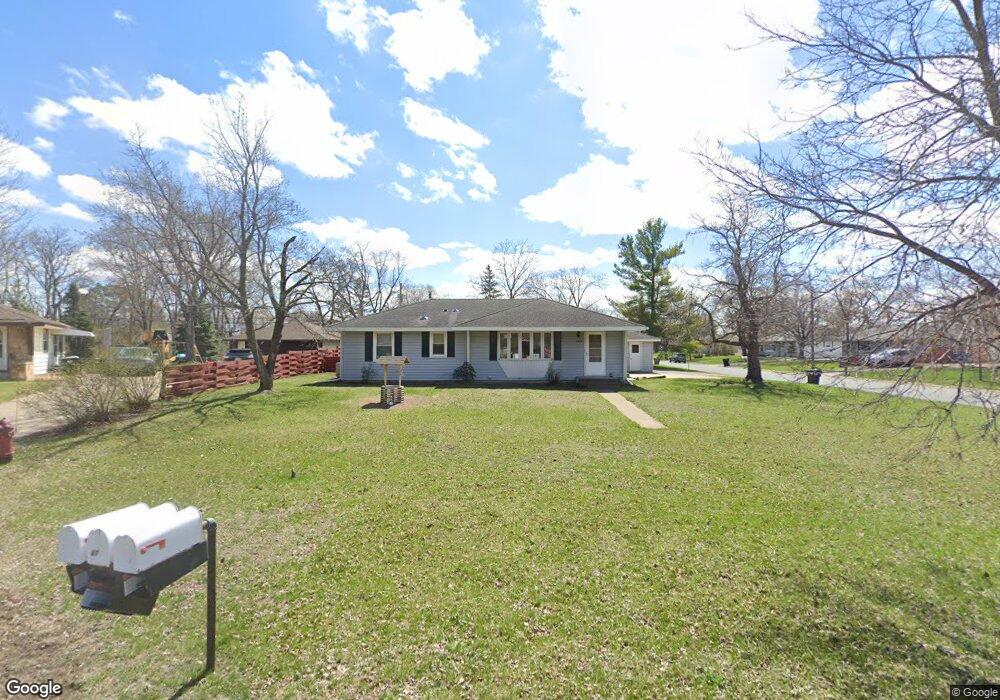
2714 113th Ave NW Coon Rapids, MN 55433
Estimated Value: $335,000 - $351,899
3
Beds
2
Baths
1,356
Sq Ft
$254/Sq Ft
Est. Value
About This Home
This home is located at 2714 113th Ave NW, Coon Rapids, MN 55433 and is currently estimated at $344,475, approximately $254 per square foot. 2714 113th Ave NW is a home located in Anoka County with nearby schools including Lucile Bruner Elementary School, Hoover Elementary School, and Laughlin Junior/Senior High School.
Ownership History
Date
Name
Owned For
Owner Type
Purchase Details
Closed on
Jan 19, 2021
Sold by
Turek Anthony S and Turek Melanie Kay
Bought by
Turek Anthony S and Turek Melanie Kay
Current Estimated Value
Home Financials for this Owner
Home Financials are based on the most recent Mortgage that was taken out on this home.
Original Mortgage
$234,300
Outstanding Balance
$208,966
Interest Rate
2.67%
Mortgage Type
New Conventional
Estimated Equity
$135,509
Purchase Details
Closed on
Mar 25, 2019
Sold by
Turek Anthony Steve and Turek Melanie Kay
Bought by
Turek Anthony S and Turek Melanie Kay
Home Financials for this Owner
Home Financials are based on the most recent Mortgage that was taken out on this home.
Original Mortgage
$232,651
Interest Rate
4.62%
Mortgage Type
FHA
Purchase Details
Closed on
Apr 24, 2016
Sold by
Crosswait Patricia Louise and Crosswait Turek Patricia
Bought by
Turek Anthony Steve
Purchase Details
Closed on
Jan 28, 1999
Sold by
Turek Thomas and Turek Donna
Bought by
Crosswait Patricia and Turek Anthony
Create a Home Valuation Report for This Property
The Home Valuation Report is an in-depth analysis detailing your home's value as well as a comparison with similar homes in the area
Home Values in the Area
Average Home Value in this Area
Purchase History
| Date | Buyer | Sale Price | Title Company |
|---|---|---|---|
| Turek Anthony S | -- | Executive Title | |
| Turek Anthony S | -- | &Executive Title | |
| Turek Anthony Steve | -- | None Available | |
| Crosswait Patricia | $119,500 | -- |
Source: Public Records
Mortgage History
| Date | Status | Borrower | Loan Amount |
|---|---|---|---|
| Open | Turek Anthony S | $234,300 | |
| Closed | Turek Anthony S | $232,651 |
Source: Public Records
Tax History Compared to Growth
Tax History
| Year | Tax Paid | Tax Assessment Tax Assessment Total Assessment is a certain percentage of the fair market value that is determined by local assessors to be the total taxable value of land and additions on the property. | Land | Improvement |
|---|---|---|---|---|
| 2025 | $3,245 | $327,200 | $84,000 | $243,200 |
| 2024 | $3,245 | $313,500 | $87,000 | $226,500 |
| 2023 | $3,177 | $304,400 | $76,000 | $228,400 |
| 2022 | $2,995 | $307,900 | $67,000 | $240,900 |
| 2021 | $2,875 | $259,400 | $67,000 | $192,400 |
| 2020 | $2,671 | $243,800 | $62,000 | $181,800 |
| 2019 | $2,467 | $218,600 | $60,000 | $158,600 |
| 2018 | $2,394 | $197,100 | $0 | $0 |
| 2017 | $2,065 | $186,200 | $0 | $0 |
| 2016 | $2,073 | $157,500 | $0 | $0 |
| 2015 | $2,193 | $157,500 | $45,000 | $112,500 |
| 2014 | -- | $145,500 | $36,500 | $109,000 |
Source: Public Records
Map
Nearby Homes
- 2851 113th Ave NW
- 2862 116th Ave NW
- 2728 109th Ln NW
- 2721 109th Ave NW
- 11749 Crooked Lake Blvd NW
- 3020 117th Ave NW
- 2400 108th Ave NW
- 2965 108th Ln NW
- 11835 Crocus St NW
- 11000 Swallow St NW
- 11409 Quinn St NW
- 10648 Wren St NW
- 11424 Hanson Blvd NW
- 12019 Zion St NW
- 11444 Hanson Blvd NW
- 11036 Hanson Blvd NW Unit 20
- 10616 Arrowhead St NW
- 2201 108th Ave NW
- 3074 121st Ave NW
- 3501 115th Ln NW
- 2706 113th Ave NW
- 11239 Bittersweet St NW
- 11248 Bittersweet St NW
- 11244 Bittersweet St NW
- 2700 113th Ave NW
- 11237 Bittersweet St NW
- 11240 Bittersweet St NW
- 2717 113th Ave NW
- 2707 113th Ave NW
- 2721 113th Ave NW
- 11236 Bittersweet St NW
- 11233 Bittersweet St NW
- 11248 Arrowhead St NW
- 2731 113th Ave NW
- 11244 Arrowhead St NW
- 11232 Bittersweet St NW
- 11309 Bittersweet St NW
- 11259 Crocus St NW
- 11252 Arrowhead St NW
- 11240 Arrowhead St NW