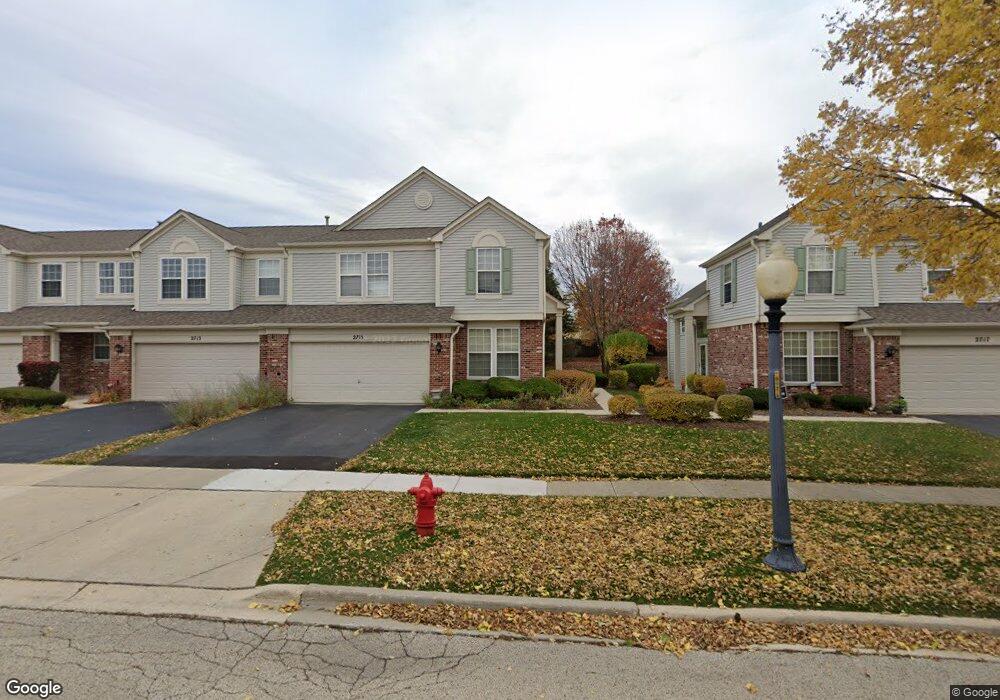
2715 Bay View Cir Algonquin, IL 60102
Far West Algonquin NeighborhoodEstimated Value: $340,000 - $369,000
3
Beds
3
Baths
1,887
Sq Ft
$187/Sq Ft
Est. Value
About This Home
This home is located at 2715 Bay View Cir, Algonquin, IL 60102 and is currently estimated at $352,081, approximately $186 per square foot. 2715 Bay View Cir is a home located in McHenry County with nearby schools including Westfield Community School, Lincoln Prairie Elementary School, and Harry D Jacobs High School.
Ownership History
Date
Name
Owned For
Owner Type
Purchase Details
Closed on
Jul 29, 2004
Sold by
Mestey Jose Noel
Bought by
Mestey Nilda
Current Estimated Value
Purchase Details
Closed on
Dec 18, 2003
Sold by
Rakowski Jennifer
Bought by
Mesty Nilda
Home Financials for this Owner
Home Financials are based on the most recent Mortgage that was taken out on this home.
Original Mortgage
$220,500
Interest Rate
8.45%
Mortgage Type
Unknown
Purchase Details
Closed on
Jun 23, 2003
Sold by
Rakowski Jennifer and Lamczyk Jennifer
Bought by
Rakowski Jennifer
Home Financials for this Owner
Home Financials are based on the most recent Mortgage that was taken out on this home.
Original Mortgage
$192,500
Interest Rate
3.12%
Mortgage Type
Unknown
Purchase Details
Closed on
Jun 28, 2001
Sold by
Pulte Homes
Bought by
Lamczyk Jennifer
Home Financials for this Owner
Home Financials are based on the most recent Mortgage that was taken out on this home.
Original Mortgage
$190,000
Interest Rate
7.18%
Create a Home Valuation Report for This Property
The Home Valuation Report is an in-depth analysis detailing your home's value as well as a comparison with similar homes in the area
Home Values in the Area
Average Home Value in this Area
Purchase History
| Date | Buyer | Sale Price | Title Company |
|---|---|---|---|
| Mestey Nilda | -- | Chicago Title Insurance Comp | |
| Mesty Nilda | $245,000 | Absolute Title Srvices Inc | |
| Rakowski Jennifer | -- | Absolute Title Services | |
| Lamczyk Jennifer | $192,535 | First American |
Source: Public Records
Mortgage History
| Date | Status | Borrower | Loan Amount |
|---|---|---|---|
| Previous Owner | Mesty Nilda | $220,500 | |
| Previous Owner | Rakowski Jennifer | $192,500 | |
| Previous Owner | Lamczyk Jennifer | $190,000 |
Source: Public Records
Tax History Compared to Growth
Tax History
| Year | Tax Paid | Tax Assessment Tax Assessment Total Assessment is a certain percentage of the fair market value that is determined by local assessors to be the total taxable value of land and additions on the property. | Land | Improvement |
|---|---|---|---|---|
| 2024 | $6,452 | $90,478 | $18,583 | $71,895 |
| 2023 | $6,104 | $80,921 | $16,620 | $64,301 |
| 2022 | $6,288 | $79,326 | $16,326 | $63,000 |
| 2021 | $6,025 | $73,902 | $15,210 | $58,692 |
| 2020 | $5,862 | $71,286 | $14,672 | $56,614 |
| 2019 | $5,714 | $68,229 | $14,043 | $54,186 |
| 2018 | $5,436 | $63,029 | $12,973 | $50,056 |
| 2017 | $5,315 | $59,377 | $12,221 | $47,156 |
| 2016 | $5,225 | $55,690 | $11,462 | $44,228 |
| 2013 | -- | $62,828 | $10,692 | $52,136 |
Source: Public Records
Map
Nearby Homes
- 2801 Waterfront Ave
- 601 Woods Creek Ln
- 1 Clara Ct Unit 4
- 16 Springbrook Ln
- 206 Cool Stone Bend
- 432 Thunder Ridge
- 3260 Nottingham Dr
- 2248 Dawson Ln Unit 272
- 341 Fairway View Dr
- 2235 Dawson Ln
- 2601 Harnish Dr
- DOVER Plan at Grand Reserve - Algonquin
- CLIFTON Plan at Grand Reserve - Algonquin
- 2611 Harnish Dr
- 2631 Harnish Dr
- 212 Village Creek Dr
- 101 Oakleaf Rd
- 2660 Harnish Dr
- 3520 Bunker Hill Dr
- 1 Wander Way
- 2713 Bay View Cir
- 2717 Bay View Cir
- 2711 Bay View Cir
- 2719 Bay View Cir
- 2719 Bay View Cir Unit 1
- 2709 Bay View Cir
- 2721 Bay View Cir
- 2707 Bay View Cir
- 2704 Bay View Cir
- 2702 Bay View Cir
- 2706 Bay View Cir
- 2700 Bay View Cir
- 2705 Bay View Cir
- 2727 Bay View Cir
- 2725 Bay View Cir
- 2723 Bay View Cir
- 2703 Bay View Cir
- 2708 Bay View Cir
- 2708 Bay View Cir Unit 102
- 2701 Bay View Cir