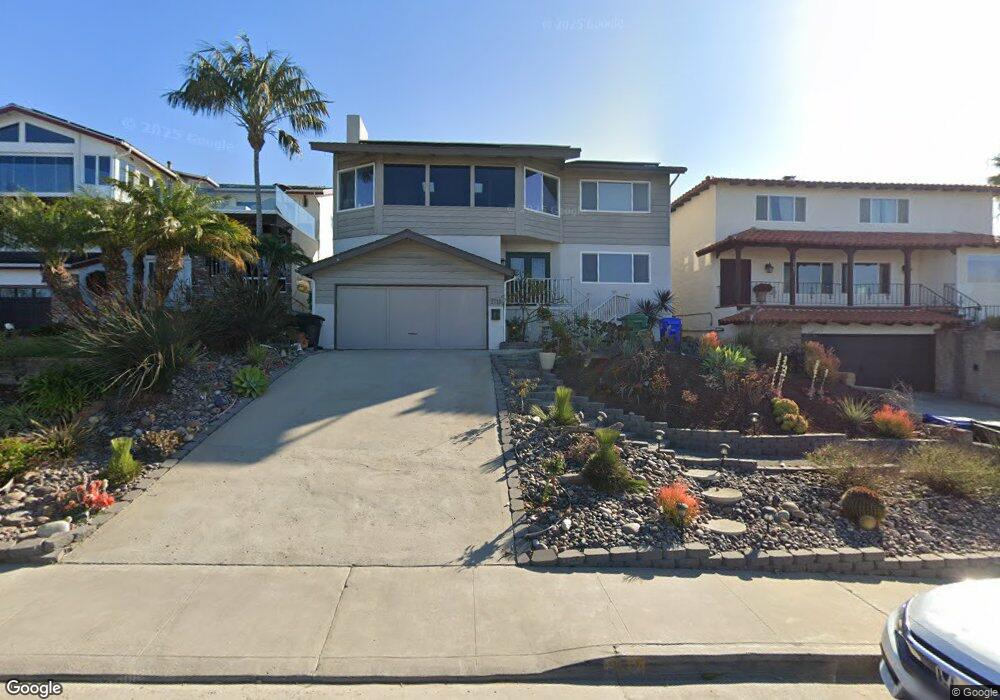
2715 Hartford St San Diego, CA 92110
Bay Park NeighborhoodEstimated Value: $1,857,000 - $2,278,000
3
Beds
3
Baths
2,154
Sq Ft
$924/Sq Ft
Est. Value
About This Home
This home is located at 2715 Hartford St, San Diego, CA 92110 and is currently estimated at $1,991,313, approximately $924 per square foot. 2715 Hartford St is a home located in San Diego County with nearby schools including Bay Park Elementary School, Marston Middle School, and Clairemont High School.
Ownership History
Date
Name
Owned For
Owner Type
Purchase Details
Closed on
Sep 26, 2023
Sold by
Nguyen Quocanh H and Nguyen Christina
Bought by
Nguyen Family Trust and Nguyen
Current Estimated Value
Purchase Details
Closed on
Oct 12, 2017
Sold by
Wilcox Dennis D and Verna Hesseltine Trust
Bought by
Nguyen Quocanh H and Nguyen Christina
Home Financials for this Owner
Home Financials are based on the most recent Mortgage that was taken out on this home.
Original Mortgage
$500,000
Interest Rate
3.78%
Mortgage Type
New Conventional
Purchase Details
Closed on
Sep 15, 1998
Sold by
Hesseltine Verna I
Bought by
Verna I Hesseltine Trust
Purchase Details
Closed on
Aug 6, 1998
Sold by
Hesseltine Verna I and Wendell Charles
Bought by
Hesseltine Verna I
Purchase Details
Closed on
Jun 24, 1998
Sold by
Hesseltine Verna I and Wendell Charles
Bought by
Hesseltine Verna I
Create a Home Valuation Report for This Property
The Home Valuation Report is an in-depth analysis detailing your home's value as well as a comparison with similar homes in the area
Home Values in the Area
Average Home Value in this Area
Purchase History
| Date | Buyer | Sale Price | Title Company |
|---|---|---|---|
| Nguyen Family Trust | -- | Simplifile | |
| Nguyen Quocanh H | $1,225,000 | Wfg Title Company Of Ca | |
| Verna I Hesseltine Trust | -- | -- | |
| Hesseltine Verna I | -- | Lawyers Title | |
| Hesseltine Verna I | -- | -- |
Source: Public Records
Mortgage History
| Date | Status | Borrower | Loan Amount |
|---|---|---|---|
| Previous Owner | Nguyen Quocanh H | $500,000 |
Source: Public Records
Tax History Compared to Growth
Tax History
| Year | Tax Paid | Tax Assessment Tax Assessment Total Assessment is a certain percentage of the fair market value that is determined by local assessors to be the total taxable value of land and additions on the property. | Land | Improvement |
|---|---|---|---|---|
| 2025 | $16,731 | $1,393,835 | $967,152 | $426,683 |
| 2024 | $16,731 | $1,366,506 | $948,189 | $418,317 |
| 2023 | $16,446 | $1,339,713 | $929,598 | $410,115 |
| 2022 | $16,009 | $1,313,445 | $911,371 | $402,074 |
| 2021 | $15,900 | $1,287,692 | $893,501 | $394,191 |
| 2020 | $15,707 | $1,274,490 | $884,340 | $390,150 |
| 2019 | $15,427 | $1,249,500 | $867,000 | $382,500 |
| 2018 | $14,421 | $1,225,000 | $850,000 | $375,000 |
| 2017 | $1,605 | $141,511 | $31,631 | $109,880 |
| 2016 | $1,283 | $113,737 | $31,011 | $82,726 |
| 2015 | $1,263 | $112,030 | $30,546 | $81,484 |
| 2014 | $1,243 | $109,836 | $29,948 | $79,888 |
Source: Public Records
Map
Nearby Homes
- 2812 Hartford Ct
- 4770 Jellett St
- 2949 Erie St
- 4603 Huron Ave
- 2910 Erie St
- 2851 Grandview St
- 2628 Grandview St
- 2916 Chicago St
- 2540 Clairemont Dr Unit 307
- 2514 Clairemont Dr Unit 306
- 2510 Clairemont Dr Unit 303
- 2540 Clairemont Dr Unit 202
- 2530 Clairemont Dr Unit 107
- 2727 Morena Blvd Unit 309
- 4436 Lister St
- 2841 Lloyd St
- 2711 Deerpark Dr
- 2802 Cowley Way
- 2261 Garfield Rd
- 4542 Milton St
- 2707 Hartford St
- 2721 Hartford St
- 2727 Hartford St
- 2721 Morava Place
- 2715 Morava Place
- 2653 Hartford St
- 2727 Morava Place
- 2649 Hartford St
- 2710 Hartford St
- 2720 Hartford St
- 2731 Morava Place
- 4666 Huxley St
- 2645 Hartford St
- 2728 Hartford St
- 2686 Illion St
- 2755 Morava Place
- 2676 Illion St
- 2740 Hartford St
- 2641 Hartford St
- 2696 Illion St