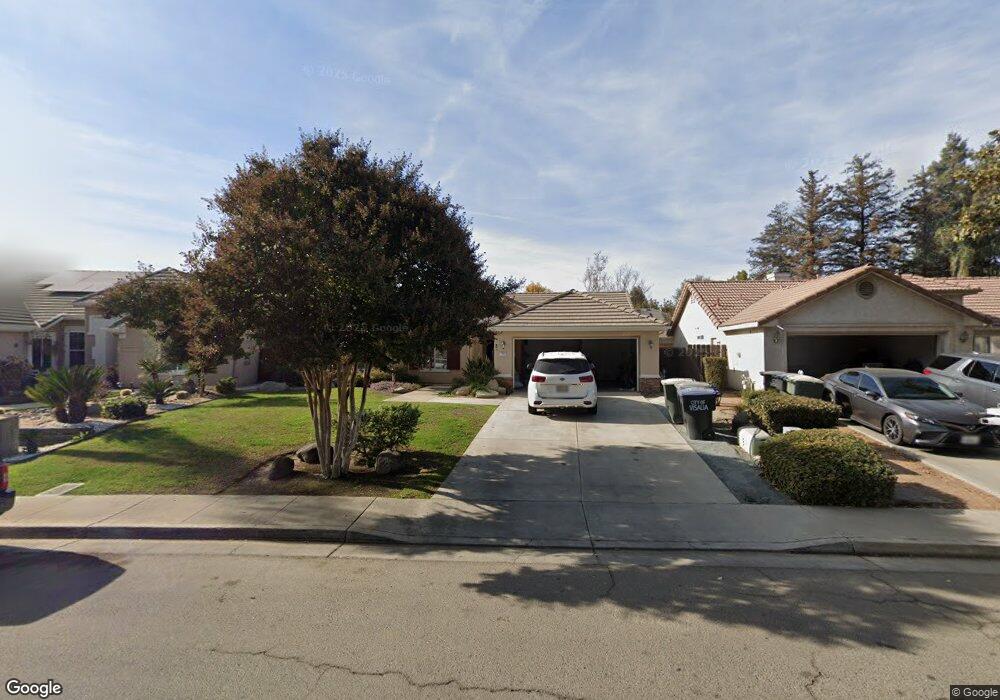
2715 S Aspen St Visalia, CA 93277
Estimated Value: $381,041 - $442,000
3
Beds
2
Baths
1,593
Sq Ft
$258/Sq Ft
Est. Value
About This Home
This home is located at 2715 S Aspen St, Visalia, CA 93277 and is currently estimated at $410,510, approximately $257 per square foot. 2715 S Aspen St is a home located in Tulare County with nearby schools including Linwood Elementary School, La Joya Middle School, and El Diamante High School.
Ownership History
Date
Name
Owned For
Owner Type
Purchase Details
Closed on
Jan 30, 2018
Sold by
Cox Michael Ray and Cox Patricia
Bought by
Reenders Bros Llc
Current Estimated Value
Purchase Details
Closed on
Apr 27, 2016
Sold by
Cox Michael Ray
Bought by
2016 Cox Family Trust
Purchase Details
Closed on
Nov 18, 2009
Sold by
Hoerner J Brent
Bought by
Cox Michael Ray and Cox Patricia
Purchase Details
Closed on
Jul 7, 2005
Sold by
Cervantes Martin M
Bought by
Hoerner J Brent and Hoerner Marjorie L
Home Financials for this Owner
Home Financials are based on the most recent Mortgage that was taken out on this home.
Original Mortgage
$248,000
Interest Rate
6.5%
Mortgage Type
New Conventional
Purchase Details
Closed on
Jul 13, 1999
Sold by
Nelson Dorothy Wood
Bought by
Nelson Dorothy Wood and Nelson Living Trust
Purchase Details
Closed on
Apr 8, 1999
Sold by
Centex Real Estate Corp
Bought by
Nelson Dorothy Wood
Create a Home Valuation Report for This Property
The Home Valuation Report is an in-depth analysis detailing your home's value as well as a comparison with similar homes in the area
Purchase History
| Date | Buyer | Sale Price | Title Company |
|---|---|---|---|
| Reenders Bros Llc | $250,000 | Chicago Title Co | |
| 2016 Cox Family Trust | -- | None Available | |
| Cox Michael Ray | $177,500 | First American Title Company | |
| Hoerner J Brent | $310,000 | Fidelity Natl Title Co Of Ca | |
| Nelson Dorothy Wood | -- | -- | |
| Nelson Dorothy Wood | $142,000 | Chicago Title Co |
Source: Public Records
Mortgage History
| Date | Status | Borrower | Loan Amount |
|---|---|---|---|
| Previous Owner | Hoerner J Brent | $248,000 |
Source: Public Records
Tax History
| Year | Tax Paid | Tax Assessment Tax Assessment Total Assessment is a certain percentage of the fair market value that is determined by local assessors to be the total taxable value of land and additions on the property. | Land | Improvement |
|---|---|---|---|---|
| 2025 | $3,230 | $284,454 | $79,647 | $204,807 |
| 2024 | $3,230 | $278,878 | $78,086 | $200,792 |
| 2023 | $3,126 | $273,410 | $76,555 | $196,855 |
| 2022 | $2,977 | $268,050 | $75,054 | $192,996 |
| 2021 | $2,981 | $262,794 | $73,582 | $189,212 |
| 2020 | $2,962 | $260,100 | $72,828 | $187,272 |
| 2019 | $2,861 | $255,000 | $71,400 | $183,600 |
| 2018 | $2,271 | $201,367 | $39,706 | $161,661 |
| 2017 | $2,234 | $197,418 | $38,927 | $158,491 |
| 2016 | $2,177 | $193,000 | $48,000 | $145,000 |
| 2015 | $2,043 | $180,000 | $45,000 | $135,000 |
| 2014 | $1,889 | $167,000 | $42,000 | $125,000 |
Source: Public Records
Map
Nearby Homes
- 5640 W Monte Verde Ct
- 1532 S Savannah St Unit And41
- 6030 W Country Ct
- 5212 W La Vida Ave Unit 9
- 3103 S Avocado St Unit 54
- 2221 S Akers St
- 2320 SW Cottonwood Cir
- 2135 SE Cottonwood Cir
- 5019 W Dorothea Ave
- 2014 S Tommy Ct
- 5411 W Mission Ave
- 6511 W Wood Dr
- 6511 W Wood Dr Unit Lot1047
- 6605 W Wood Dr Unit Lot1050
- 1537 S Jacques St Unit And 53
- 1529 S Jacques St Unit And54
- 6522 W Galileo Dr Unit Lot1032
- 6522 W Galileo Dr
- 6521 W Wood Dr Unit Lot1048
- 4918 W Chestnut Ave
- 2705 S Aspen St
- 2725 S Aspen St
- 2650 S Peppertree St
- 2646 S Peppertree St
- 2647 S Aspen St
- 2737 S Aspen St
- 2636 S Peppertree St
- 5701 W Country Ave
- 2637 S Aspen St
- 2624 S Peppertree St
- 2629 S Aspen St
- 5705 W Country Ave
- 2649 S Peppertree St
- 5542 W Country Ave
- 2645 S Peppertree St
- 2614 S Peppertree St
- 2803 S Aspen St
- 2635 S Peppertree St
- 2621 S Aspen St
- 5711 W Country Ave
Your Personal Tour Guide
Ask me questions while you tour the home.