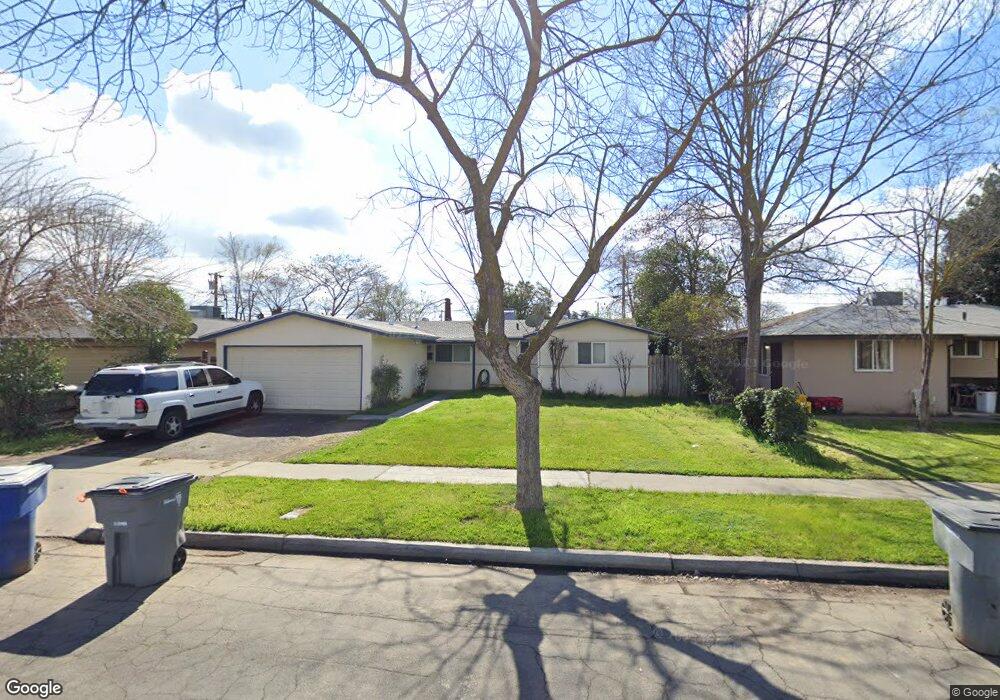
2716 E Swift Ave Fresno, CA 93726
Hoover NeighborhoodEstimated Value: $281,000 - $304,000
3
Beds
2
Baths
1,213
Sq Ft
$239/Sq Ft
Est. Value
About This Home
This home is located at 2716 E Swift Ave, Fresno, CA 93726 and is currently estimated at $289,872, approximately $238 per square foot. 2716 E Swift Ave is a home located in Fresno County with nearby schools including Pyle Elementary School, Tioga Middle School, and Herbert Hoover High School.
Ownership History
Date
Name
Owned For
Owner Type
Purchase Details
Closed on
Apr 30, 2012
Sold by
Taylor Sharon D and Johnston Carla K
Bought by
Obi Comia Lauren
Current Estimated Value
Home Financials for this Owner
Home Financials are based on the most recent Mortgage that was taken out on this home.
Original Mortgage
$84,736
Interest Rate
4.37%
Mortgage Type
FHA
Purchase Details
Closed on
Apr 23, 1998
Sold by
Day Jean J
Bought by
Taylor Sharon D and Johnston Carla K
Home Financials for this Owner
Home Financials are based on the most recent Mortgage that was taken out on this home.
Original Mortgage
$65,628
Interest Rate
7.17%
Mortgage Type
FHA
Create a Home Valuation Report for This Property
The Home Valuation Report is an in-depth analysis detailing your home's value as well as a comparison with similar homes in the area
Home Values in the Area
Average Home Value in this Area
Purchase History
| Date | Buyer | Sale Price | Title Company |
|---|---|---|---|
| Obi Comia Lauren | $86,500 | Chicago Title Company | |
| Taylor Sharon D | $66,000 | Fidelity National Title Co |
Source: Public Records
Mortgage History
| Date | Status | Borrower | Loan Amount |
|---|---|---|---|
| Previous Owner | Obi Comia Lauren | $84,736 | |
| Previous Owner | Taylor Sharon D | $65,628 |
Source: Public Records
Tax History Compared to Growth
Tax History
| Year | Tax Paid | Tax Assessment Tax Assessment Total Assessment is a certain percentage of the fair market value that is determined by local assessors to be the total taxable value of land and additions on the property. | Land | Improvement |
|---|---|---|---|---|
| 2025 | $1,395 | $105,891 | $31,763 | $74,128 |
| 2023 | $1,343 | $101,781 | $30,531 | $71,250 |
| 2022 | $1,300 | $99,786 | $29,933 | $69,853 |
| 2021 | $1,265 | $97,831 | $29,347 | $68,484 |
| 2020 | $1,260 | $96,829 | $29,047 | $67,782 |
| 2019 | $1,212 | $94,931 | $28,478 | $66,453 |
| 2018 | $1,186 | $93,070 | $27,920 | $65,150 |
| 2017 | $1,166 | $91,246 | $27,373 | $63,873 |
| 2016 | $1,128 | $89,458 | $26,837 | $62,621 |
| 2015 | $1,111 | $88,115 | $26,434 | $61,681 |
| 2014 | -- | $86,390 | $25,917 | $60,473 |
Source: Public Records
Map
Nearby Homes
- 2733 E Willis Ave
- 4326 N Fresno St
- 2542 E Ashcroft Ave
- 2999 E Richert Ave
- 2333 E Austin Way
- 2972 E Northdale Ave
- 2817 E Indianapolis Ave
- 2407 Ashcroft Ct
- 2719 E Norwich Ave
- 4136 N Thesta St Unit 36
- 4136 N Thesta St
- 4136 N Thesta St Unit 31
- 2316 E Hampton Way
- 2316 E Norwich Ave
- 4005 N 1st St
- 2108 E Sussex Way
- 3214 E Griffith Way
- 3310 E Hampton Way
- 2723 E Lansing Way
- 1898 E Gettysburg Ave Unit 107
- 2726 E Swift Ave
- 2706 E Swift Ave
- 2713 E Willis Ave
- 2703 E Willis Ave
- 2723 E Willis Ave
- 2736 E Swift Ave
- 2715 E Swift Ave
- 2725 E Swift Ave
- 2705 E Swift Ave
- 2746 E Swift Ave
- 4303 N Augusta St
- 2735 E Swift Ave
- 2743 E Willis Ave
- 4295 N Augusta St
- 30854 E Willis Ave
- 2806 E Swift Ave
- 2745 E Swift Ave
- 4343 N Augusta St
- 2803 E Willis Ave
- 2714 E Richert Ave