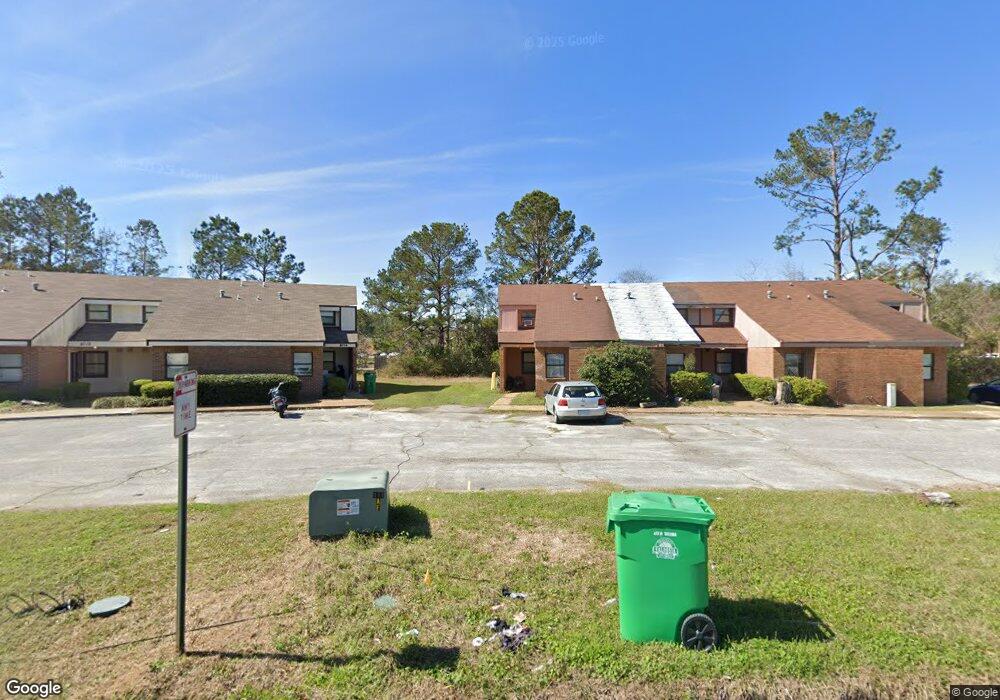
2716 Tyndall Dr Valdosta, GA 31602
Estimated Value: $114,324 - $153,000
2
Beds
2
Baths
1,061
Sq Ft
$127/Sq Ft
Est. Value
About This Home
This home is located at 2716 Tyndall Dr, Valdosta, GA 31602 and is currently estimated at $134,581, approximately $126 per square foot. 2716 Tyndall Dr is a home located in Lowndes County with nearby schools including W.G. Nunn Elementary School, Newbern Middle School, and Valdosta High School.
Ownership History
Date
Name
Owned For
Owner Type
Purchase Details
Closed on
Oct 29, 2013
Sold by
Parker Johnny C
Bought by
Parker Johnny C and Parker Brittany
Current Estimated Value
Purchase Details
Closed on
Aug 8, 2013
Sold by
Berrian Mary L
Bought by
Parker Johnny C
Home Financials for this Owner
Home Financials are based on the most recent Mortgage that was taken out on this home.
Original Mortgage
$7,000
Interest Rate
4.48%
Mortgage Type
New Conventional
Purchase Details
Closed on
Jun 8, 2007
Sold by
Berrian Mary L and Berrian Charle
Bought by
Berrian Mary L
Purchase Details
Closed on
Aug 24, 1995
Sold by
Berrian Mary L
Bought by
Berrian Mary L and Berrian Charle
Purchase Details
Closed on
Jun 20, 1984
Bought by
Bowen Howard E
Purchase Details
Closed on
Jun 13, 1984
Bought by
Mackey Lumber Co
Purchase Details
Closed on
Aug 31, 1983
Bought by
Minchew Gary Const Inc
Create a Home Valuation Report for This Property
The Home Valuation Report is an in-depth analysis detailing your home's value as well as a comparison with similar homes in the area
Home Values in the Area
Average Home Value in this Area
Purchase History
| Date | Buyer | Sale Price | Title Company |
|---|---|---|---|
| Parker Johnny C | -- | -- | |
| Parker Johnny C | $20,000 | -- | |
| Berrian Mary L | -- | -- | |
| Berrian Mary L | $35,000 | -- | |
| Bowen Howard E | $37,500 | -- | |
| Mackey Lumber Co | $34,000 | -- | |
| Mackey Berkely M | $34,000 | -- | |
| Minchew Gary Const Inc | $12,000 | -- |
Source: Public Records
Mortgage History
| Date | Status | Borrower | Loan Amount |
|---|---|---|---|
| Previous Owner | Parker Johnny C | $7,000 |
Source: Public Records
Tax History Compared to Growth
Tax History
| Year | Tax Paid | Tax Assessment Tax Assessment Total Assessment is a certain percentage of the fair market value that is determined by local assessors to be the total taxable value of land and additions on the property. | Land | Improvement |
|---|---|---|---|---|
| 2024 | -- | $21,992 | $2,000 | $19,992 |
| 2023 | $0 | $21,992 | $2,000 | $19,992 |
| 2022 | $429 | $12,696 | $2,000 | $10,696 |
| 2021 | $421 | $12,696 | $2,000 | $10,696 |
| 2020 | $421 | $12,696 | $2,000 | $10,696 |
| 2019 | $421 | $12,696 | $2,000 | $10,696 |
| 2018 | $0 | $12,696 | $2,000 | $10,696 |
| 2017 | $0 | $12,696 | $2,000 | $10,696 |
| 2016 | $0 | $15,584 | $3,000 | $12,584 |
| 2015 | -- | $18,219 | $3,000 | $15,219 |
| 2014 | -- | $18,219 | $3,000 | $15,219 |
Source: Public Records
Map
Nearby Homes
- 1703 Largo Cir
- 1647 Fresno St
- 11 Crestwood Cir
- 7.63 AC Tyndall Dr
- 1 Pomona Cir
- 2019 Fallingleaf Ln
- 2517 Deborah Dr
- 2835 Kirkwood Cir
- 2745 Pineview Dr
- 2414 Deborah Dr
- 2713 Pineview Dr Unit A&B
- 1724 Eli Place
- 3016 Ginny Dr
- 3122 Tyndall Dr
- 0 Northside Dr Unit 145194
- TBD Jaycee Shack Rd
- 2821 Clayton Dr
- 1852 Chestnut Dr
- 1739 Eli Place
- 3200 Tyndall Dr Unit A/B
- 2718 Tyndall Dr
- 2714 Tyndall Dr
- 2720 Tyndall Dr
- 2712 Tyndall Dr
- 2722 Tyndall Dr
- 2710 Tyndall Dr
- 2708 Tyndall Dr
- 2724 Tyndall Dr
- 2726 Tyndall Dr
- 2728 Tyndall Dr
- 2730 Tyndall Dr
- 2727 Tyndall Dr
- 2732 Tyndall Dr
- 2734 Tyndall Dr
- 2729 Tyndall Dr
- 2736 Tyndall Dr
- 2701 Tyndall Dr
- 2701 Tyndall Dr Unit A&B
- 2738 Tyndall Dr
- 2731 Tyndall Dr