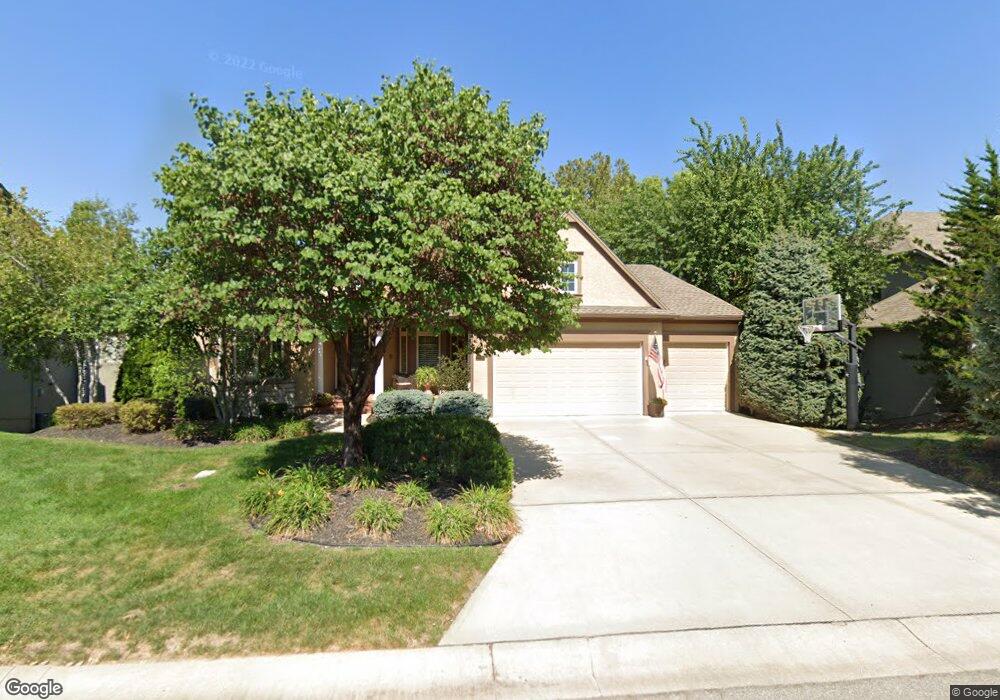
2716 W 132nd St Leawood, KS 66209
Estimated Value: $770,000 - $836,000
4
Beds
5
Baths
2,424
Sq Ft
$332/Sq Ft
Est. Value
About This Home
This home is located at 2716 W 132nd St, Leawood, KS 66209 and is currently estimated at $805,690, approximately $332 per square foot. 2716 W 132nd St is a home located in Johnson County with nearby schools including Mission Trail Elementary School, Leawood Middle School, and Blue Valley North High School.
Ownership History
Date
Name
Owned For
Owner Type
Purchase Details
Closed on
Aug 7, 2015
Sold by
Bandy David W and Bandy Nancy J
Bought by
Bandy David W and Revocabl Nancy J Bandy
Current Estimated Value
Purchase Details
Closed on
Mar 8, 2011
Sold by
Bandy Nancy J
Bought by
Bandy David W and David W Bandy Revocable Trust
Purchase Details
Closed on
Aug 7, 2007
Sold by
Ashner Construction Co Inc
Bought by
Bandy David W and Bandy Nancy J
Home Financials for this Owner
Home Financials are based on the most recent Mortgage that was taken out on this home.
Original Mortgage
$190,000
Outstanding Balance
$120,175
Interest Rate
6.64%
Mortgage Type
New Conventional
Estimated Equity
$685,515
Purchase Details
Closed on
Jul 21, 2006
Sold by
Wilshire Place Llc
Bought by
Ashner Construction Co Inc
Home Financials for this Owner
Home Financials are based on the most recent Mortgage that was taken out on this home.
Original Mortgage
$488,440
Interest Rate
6.62%
Mortgage Type
Construction
Create a Home Valuation Report for This Property
The Home Valuation Report is an in-depth analysis detailing your home's value as well as a comparison with similar homes in the area
Home Values in the Area
Average Home Value in this Area
Purchase History
| Date | Buyer | Sale Price | Title Company |
|---|---|---|---|
| Bandy David W | -- | None Available | |
| Bandy David W | -- | First American Title | |
| Bandy David W | -- | First American Title Ins | |
| Ashner Construction Co Inc | -- | First American Title |
Source: Public Records
Mortgage History
| Date | Status | Borrower | Loan Amount |
|---|---|---|---|
| Open | Bandy David W | $190,000 | |
| Previous Owner | Ashner Construction Co Inc | $488,440 | |
| Previous Owner | Ashner Construction Co Inc | $79,960 |
Source: Public Records
Tax History Compared to Growth
Tax History
| Year | Tax Paid | Tax Assessment Tax Assessment Total Assessment is a certain percentage of the fair market value that is determined by local assessors to be the total taxable value of land and additions on the property. | Land | Improvement |
|---|---|---|---|---|
| 2024 | $9,805 | $87,745 | $14,837 | $72,908 |
| 2023 | $9,428 | $83,398 | $14,837 | $68,561 |
| 2022 | $8,300 | $71,932 | $14,837 | $57,095 |
| 2021 | $8,407 | $69,609 | $14,837 | $54,772 |
| 2020 | $8,916 | $72,312 | $14,837 | $57,475 |
| 2019 | $9,387 | $74,750 | $20,235 | $54,515 |
| 2018 | $9,602 | $75,083 | $18,387 | $56,696 |
| 2017 | $9,912 | $73,681 | $15,317 | $58,364 |
| 2016 | $9,291 | $68,862 | $12,770 | $56,092 |
| 2015 | $9,237 | $67,540 | $12,770 | $54,770 |
| 2013 | -- | $65,331 | $11,594 | $53,737 |
Source: Public Records
Map
Nearby Homes
- 2549 W 132nd Terrace
- The Forester Plan at East Village
- Fleetwood Villa Plan at East Village
- 13240 Falmouth St
- 12854 Pembroke Cir
- The Aspen Plan at East Village - Twin Villas
- The Breckenridge 2 Car Plan at East Village - Twin Villas
- The Breckenridge 3 Car Plan at East Village - Twin Villas
- The Basalt Plan at East Village - Twin Villas
- The Avon Plan at East Village - Twin Villas
- 12725 High Dr
- 12851 Pembroke Cir
- 13280 Falmouth St
- 12815 Pembroke Cir
- 2229 Condolea Terrace
- 12854 Cambridge Terrace
- 2218 Condolea Terrace
- The Belmont Plan at Regents Park - Twin Home Plans
- The Camden Plan at Regents Park - Twin Home Plans
- The Kensington Plan at Regents Park - Twin Home Plans
- 2720 W 132nd St
- 2712 W 132nd St
- 2753 W 131st Terrace
- 2757 W 131st Terrace
- 2713 W 132nd St
- 2800 W 132nd St
- 2717 W 132nd St
- 2749 W 131st Terrace
- 2709 W 132nd St
- 2708 W 132nd St
- 2801 W 132nd St
- 2841 W 131st Terrace
- 2804 W 132nd St
- 2805 W 132nd St
- 2705 W 132nd St
- 2745 W 131st Terrace
- 2752 W 131st Terrace
- 13281 High Dr
- 2656 W 132nd Terrace
- 13253 High Dr