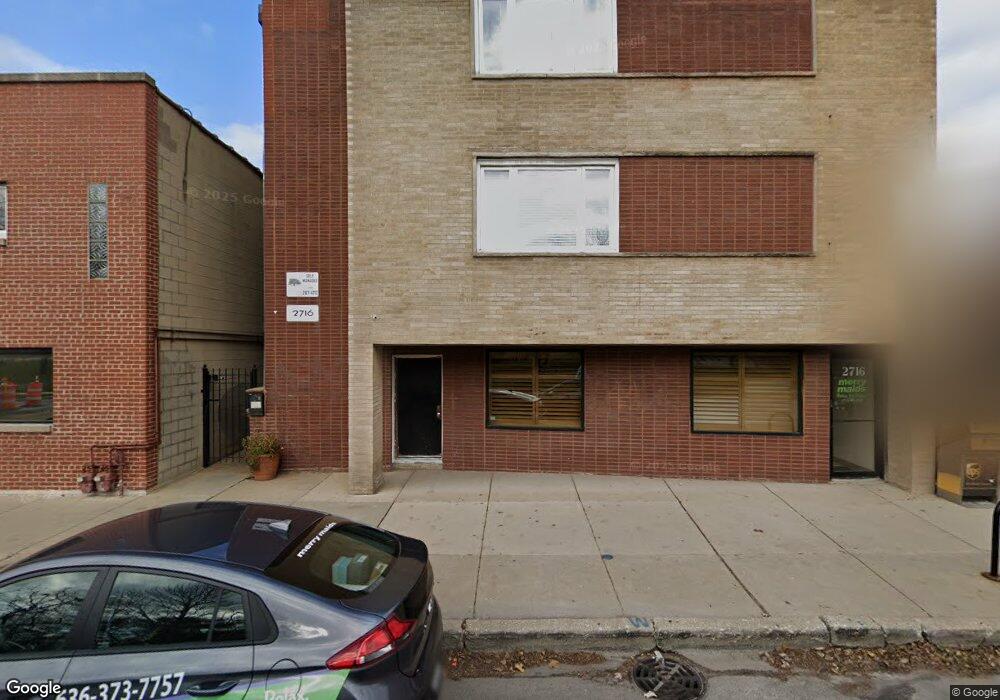
2716 W Montrose Ave Unit 2A Chicago, IL 60618
Ravenswood NeighborhoodEstimated Value: $267,000 - $507,000
--
Bed
--
Bath
7,290
Sq Ft
$48/Sq Ft
Est. Value
About This Home
This home is located at 2716 W Montrose Ave Unit 2A, Chicago, IL 60618 and is currently estimated at $352,552, approximately $48 per square foot. 2716 W Montrose Ave Unit 2A is a home located in Cook County with nearby schools including Waters Elementary School, Roosevelt High School, and Queen Of Angels Elementary School.
Ownership History
Date
Name
Owned For
Owner Type
Purchase Details
Closed on
Jul 11, 2017
Sold by
Pieta Oprea Aneli and Pieta Garret
Bought by
Oprea Aneli
Current Estimated Value
Home Financials for this Owner
Home Financials are based on the most recent Mortgage that was taken out on this home.
Original Mortgage
$140,000
Outstanding Balance
$117,819
Interest Rate
4.37%
Mortgage Type
New Conventional
Estimated Equity
$234,733
Purchase Details
Closed on
Dec 17, 2013
Sold by
Bradley Ella
Bought by
Garrett Pieta and Oprea Aneli
Home Financials for this Owner
Home Financials are based on the most recent Mortgage that was taken out on this home.
Original Mortgage
$133,536
Interest Rate
4.25%
Mortgage Type
FHA
Purchase Details
Closed on
Mar 31, 2000
Sold by
Gotham City Development Llc
Bought by
Land Allen D
Home Financials for this Owner
Home Financials are based on the most recent Mortgage that was taken out on this home.
Original Mortgage
$134,100
Interest Rate
8%
Create a Home Valuation Report for This Property
The Home Valuation Report is an in-depth analysis detailing your home's value as well as a comparison with similar homes in the area
Home Values in the Area
Average Home Value in this Area
Purchase History
| Date | Buyer | Sale Price | Title Company |
|---|---|---|---|
| Oprea Aneli | -- | Ravenswood Title Company Llc | |
| Garrett Pieta | $136,000 | Chicago Title Insurance Co | |
| Land Allen D | $149,000 | -- |
Source: Public Records
Mortgage History
| Date | Status | Borrower | Loan Amount |
|---|---|---|---|
| Open | Oprea Aneli | $140,000 | |
| Closed | Garrett Pieta | $133,536 | |
| Previous Owner | Land Allen D | $134,100 |
Source: Public Records
Tax History Compared to Growth
Tax History
| Year | Tax Paid | Tax Assessment Tax Assessment Total Assessment is a certain percentage of the fair market value that is determined by local assessors to be the total taxable value of land and additions on the property. | Land | Improvement |
|---|---|---|---|---|
| 2024 | $4,451 | $24,071 | $2,663 | $21,408 |
| 2023 | $4,336 | $20,000 | $2,500 | $17,500 |
| 2022 | $4,336 | $20,000 | $2,500 | $17,500 |
| 2021 | $4,233 | $19,998 | $2,499 | $17,499 |
| 2020 | $3,205 | $13,653 | $1,800 | $11,853 |
| 2019 | $3,191 | $15,062 | $1,800 | $13,262 |
| 2018 | $3,137 | $15,062 | $1,800 | $13,262 |
| 2017 | $2,909 | $12,803 | $1,575 | $11,228 |
| 2016 | $2,713 | $12,803 | $1,575 | $11,228 |
| 2015 | $2,486 | $12,803 | $1,575 | $11,228 |
| 2014 | $3,182 | $16,093 | $1,462 | $14,631 |
| 2013 | $2,610 | $16,093 | $1,462 | $14,631 |
Source: Public Records
Map
Nearby Homes
- 4529 N Mozart St
- 2901 W Sunnyside Ave
- 4347 N Richmond St Unit 1N
- 4347 N Richmond St Unit 1S
- 4347 N Richmond St Unit 3N
- 4347 N Richmond St Unit 2N
- 2461 W Pensacola Ave
- 4343 N Sacramento Ave Unit A-G
- 4425 N Sacramento Ave
- 4411 N Sacramento Ave Unit 1
- 2617 W Leland Ave Unit 1
- 2468 W Berteau Ave
- 2418 W Pensacola Ave
- 4437 N Whipple St
- 2438 W Berteau Ave
- 2540 W Leland Ave Unit 2
- 2455 W Leland Ave Unit 1
- 2754 W Giddings St
- 3055 W Sunnyside Ave Unit 1
- 2709 W Lawrence Ave Unit 3
- 2716 W Montrose Ave Unit 2
- 2716 W Montrose Ave Unit 2B
- 2716 W Montrose Ave Unit 2C
- 2716 W Montrose Ave Unit 3C
- 2716 W Montrose Ave Unit 3B
- 2716 W Montrose Ave Unit 3A
- 2716 W Montrose Ave Unit 1AB
- 2716 W Montrose Ave Unit 5
- 2716 W Montrose Ave Unit 3
- 2716 W Montrose Ave Unit 1
- 2714 W Montrose Ave
- 2714 W Montrose Ave Unit 1E
- 2722 W Montrose Ave
- 2736 W Montrose Ave Unit 1W
- 2736 W Montrose Ave Unit 3W
- 2736 W Montrose Ave Unit 1W
- 2736 W Montrose Ave Unit 1E
- 2736 W Montrose Ave Unit 2E
- 2736 W Montrose Ave Unit 3E
- 2736 W Montrose Ave Unit 2W