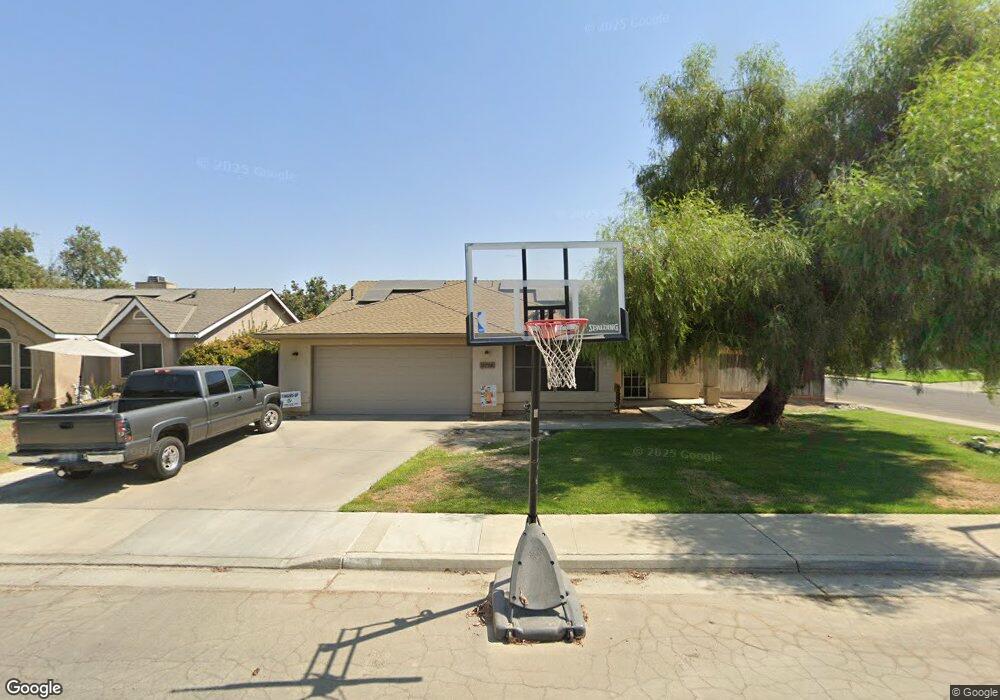
2717 Pine Castle Dr Hanford, CA 93230
Estimated Value: $378,000 - $406,000
3
Beds
2
Baths
1,679
Sq Ft
$231/Sq Ft
Est. Value
About This Home
This home is located at 2717 Pine Castle Dr, Hanford, CA 93230 and is currently estimated at $387,359, approximately $230 per square foot. 2717 Pine Castle Dr is a home located in Kings County with nearby schools including Hanford High School, Kings River-Hardwick Elementary School, and Pioneer Middle School.
Ownership History
Date
Name
Owned For
Owner Type
Purchase Details
Closed on
Nov 18, 2004
Sold by
Brosseau Teri L
Bought by
Brosseau Scott F and Brosseau Teri L
Current Estimated Value
Purchase Details
Closed on
Jan 24, 2002
Sold by
Brosseau Scott F
Bought by
Brosseau Teri L
Home Financials for this Owner
Home Financials are based on the most recent Mortgage that was taken out on this home.
Original Mortgage
$128,250
Outstanding Balance
$52,893
Interest Rate
7.17%
Estimated Equity
$334,466
Purchase Details
Closed on
Jan 23, 2002
Sold by
Bowers Judith I
Bought by
Brosseau Teri L
Home Financials for this Owner
Home Financials are based on the most recent Mortgage that was taken out on this home.
Original Mortgage
$128,250
Outstanding Balance
$52,893
Interest Rate
7.17%
Estimated Equity
$334,466
Purchase Details
Closed on
Dec 11, 1997
Sold by
Tavarez Anthony M and Tavarez Carrie L
Bought by
Bowers Judith L
Home Financials for this Owner
Home Financials are based on the most recent Mortgage that was taken out on this home.
Original Mortgage
$111,853
Interest Rate
7.05%
Mortgage Type
VA
Create a Home Valuation Report for This Property
The Home Valuation Report is an in-depth analysis detailing your home's value as well as a comparison with similar homes in the area
Home Values in the Area
Average Home Value in this Area
Purchase History
| Date | Buyer | Sale Price | Title Company |
|---|---|---|---|
| Brosseau Scott F | -- | -- | |
| Brosseau Teri L | -- | Cuesta Title Company | |
| Brosseau Teri L | $135,000 | Cuesta Title Company | |
| Bowers Judith L | $116,000 | Kings County Title Company |
Source: Public Records
Mortgage History
| Date | Status | Borrower | Loan Amount |
|---|---|---|---|
| Open | Brosseau Teri L | $128,250 | |
| Previous Owner | Bowers Judith L | $111,853 |
Source: Public Records
Tax History
| Year | Tax Paid | Tax Assessment Tax Assessment Total Assessment is a certain percentage of the fair market value that is determined by local assessors to be the total taxable value of land and additions on the property. | Land | Improvement |
|---|---|---|---|---|
| 2025 | $2,233 | $201,487 | $51,705 | $149,782 |
| 2023 | $2,233 | $193,666 | $49,699 | $143,967 |
| 2022 | $2,155 | $189,870 | $48,725 | $141,145 |
| 2021 | $2,115 | $186,148 | $47,770 | $138,378 |
| 2020 | $2,114 | $184,239 | $47,280 | $136,959 |
| 2019 | $2,097 | $180,627 | $46,353 | $134,274 |
| 2018 | $2,061 | $177,085 | $45,444 | $131,641 |
| 2017 | $1,963 | $173,613 | $44,553 | $129,060 |
| 2016 | $1,913 | $170,208 | $43,679 | $126,529 |
| 2015 | $1,893 | $167,651 | $43,023 | $124,628 |
| 2014 | $1,868 | $164,367 | $42,180 | $122,187 |
Source: Public Records
Map
Nearby Homes
- 950 Cedarwood St
- 2403 Cherrywood Ct
- 982 Cedarwood St
- 2411 Cottonwood Dr
- 2301 N 10th Ave
- 2202 Cottonwood Ct
- 969 Lakewood Dr
- 2215 N Mayfair Dr
- 2335 N Douty St
- 2109 N Kensington Way
- 230 W Ash Ave
- 2083 Parker Place
- 120 W Magnolia Ave
- 300 W Adrian Way
- 2055 N Burl Dr
- 180 W Magnolia Ave
- 2892 Aspen St
- 975 Salem Dr
- 2234 Carter Way
- 2116 N Woodridge Way
- 746 E Palm Dr
- 2741 Pine Castle Dr
- 762 E Palm Dr
- 731 E Palm Dr
- 745 E Palm Dr
- 2712 Pine Castle Dr
- 2768 Lake Cir
- 761 E Palm Dr
- 2753 Pine Castle Dr
- 2736 Pine Castle Dr
- 2700 Pine Castle Dr
- 778 E Palm Dr
- 2748 Pine Castle Dr
- 777 E Palm Dr
- 2756 Lake Cir
- 2694 Pine Castle Dr
- 2765 Pine Castle Dr
- 732 E Orange St
- 794 E Palm Dr
- 2760 Pine Castle Dr
Your Personal Tour Guide
Ask me questions while you tour the home.