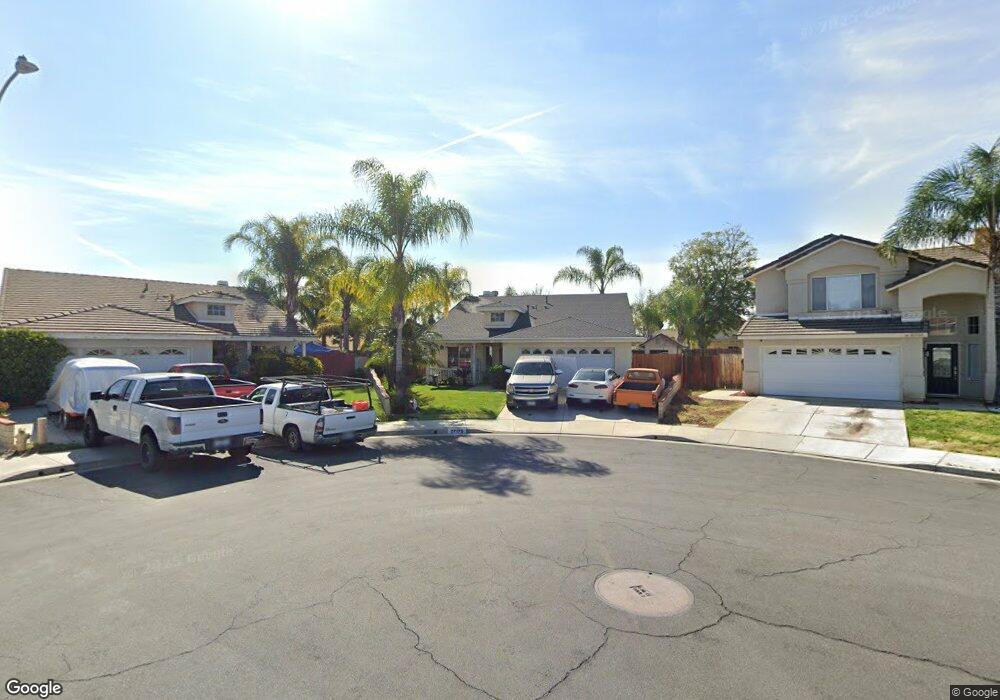
27175 Hemingway Ct Menifee, CA 92584
Paloma Valley NeighborhoodEstimated Value: $575,000 - $592,172
4
Beds
2
Baths
1,728
Sq Ft
$337/Sq Ft
Est. Value
About This Home
This home is located at 27175 Hemingway Ct, Menifee, CA 92584 and is currently estimated at $583,043, approximately $337 per square foot. 27175 Hemingway Ct is a home located in Riverside County with nearby schools including Chester W. Morrison Elementary School, Menifee Valley Middle School, and Pinacate Middle School.
Ownership History
Date
Name
Owned For
Owner Type
Purchase Details
Closed on
Aug 4, 1999
Sold by
Hud
Bought by
Frigo James D and Frigo Christina
Current Estimated Value
Home Financials for this Owner
Home Financials are based on the most recent Mortgage that was taken out on this home.
Original Mortgage
$138,855
Outstanding Balance
$39,341
Interest Rate
7.47%
Mortgage Type
FHA
Estimated Equity
$543,702
Purchase Details
Closed on
Mar 31, 1999
Sold by
Homeside Lending Inc
Bought by
Hud
Purchase Details
Closed on
Jan 13, 1999
Sold by
Crawford Corey G and Crawford Ivania Y
Bought by
Homeside Lending Inc
Purchase Details
Closed on
Dec 1, 1995
Sold by
Thomas Pegg
Bought by
Crawford Corey G and Crawford Ivania Y
Home Financials for this Owner
Home Financials are based on the most recent Mortgage that was taken out on this home.
Original Mortgage
$127,022
Interest Rate
8.01%
Mortgage Type
FHA
Create a Home Valuation Report for This Property
The Home Valuation Report is an in-depth analysis detailing your home's value as well as a comparison with similar homes in the area
Home Values in the Area
Average Home Value in this Area
Purchase History
| Date | Buyer | Sale Price | Title Company |
|---|---|---|---|
| Frigo James D | $140,000 | Gateway Title Company | |
| Hud | $138,763 | -- | |
| Homeside Lending Inc | $138,763 | Fidelity National Title | |
| Crawford Corey G | $128,500 | First American Title Ins Co |
Source: Public Records
Mortgage History
| Date | Status | Borrower | Loan Amount |
|---|---|---|---|
| Open | Frigo James D | $138,855 | |
| Previous Owner | Crawford Corey G | $127,022 |
Source: Public Records
Tax History Compared to Growth
Tax History
| Year | Tax Paid | Tax Assessment Tax Assessment Total Assessment is a certain percentage of the fair market value that is determined by local assessors to be the total taxable value of land and additions on the property. | Land | Improvement |
|---|---|---|---|---|
| 2025 | $2,408 | $273,691 | $53,777 | $219,914 |
| 2023 | $2,408 | $263,065 | $51,690 | $211,375 |
| 2022 | $4,043 | $257,908 | $50,677 | $207,231 |
| 2021 | $4,031 | $252,852 | $49,684 | $203,168 |
| 2020 | $3,981 | $250,260 | $49,175 | $201,085 |
| 2019 | $3,912 | $245,354 | $48,211 | $197,143 |
| 2018 | $3,779 | $240,544 | $47,267 | $193,277 |
| 2017 | $3,723 | $235,829 | $46,341 | $189,488 |
| 2016 | $3,632 | $231,206 | $45,433 | $185,773 |
| 2015 | $3,585 | $227,735 | $44,751 | $182,984 |
| 2014 | $3,505 | $223,275 | $43,875 | $179,400 |
Source: Public Records
Map
Nearby Homes
- 27136 School Park Dr
- 30550 Stern Dr
- 30535 Ridgely Way
- 27321 La Piedra Rd
- 26966 Canberra St
- 30581 Old Windmill Rd
- 30645 Old Windmill Rd
- 30525 Old Windmill Rd
- 26943 Mirabella Ct
- 27174 Augusta Ave
- 30548 Carey Rd
- 27283 Chase Rd
- 30620 Old Windmill Rd
- 30779 Lajoe St
- 30640 Old Windmill Rd
- 30521 Sierra Vista Dr
- 30750 Old Windmill Rd
- 30701 Sherman Rd
- 30569 Wyndham Ct
- 27080 Sapphire St
- 27165 Hemingway Ct
- 27185 Hemingway Ct
- 27202 Fitzgerald Place
- 27192 Fitzgerald Place
- 27155 Hemingway Ct
- 30549 Glaspell Ct
- 27172 Fitzgerald Place
- 30559 Glaspell Ct
- 27180 Hemingway Ct
- 27145 Hemingway Ct
- 27162 Fitzgerald Place
- 30529 Glaspell Ct
- 27170 Hemingway Ct
- 27160 Hemingway Ct
- 27152 Fitzgerald Place
- 27135 Hemingway Ct
- 27150 Hemingway Ct
- 30589 Glaspell Ct
- 30519 Glaspell Ct
- 27142 Fitzgerald Place