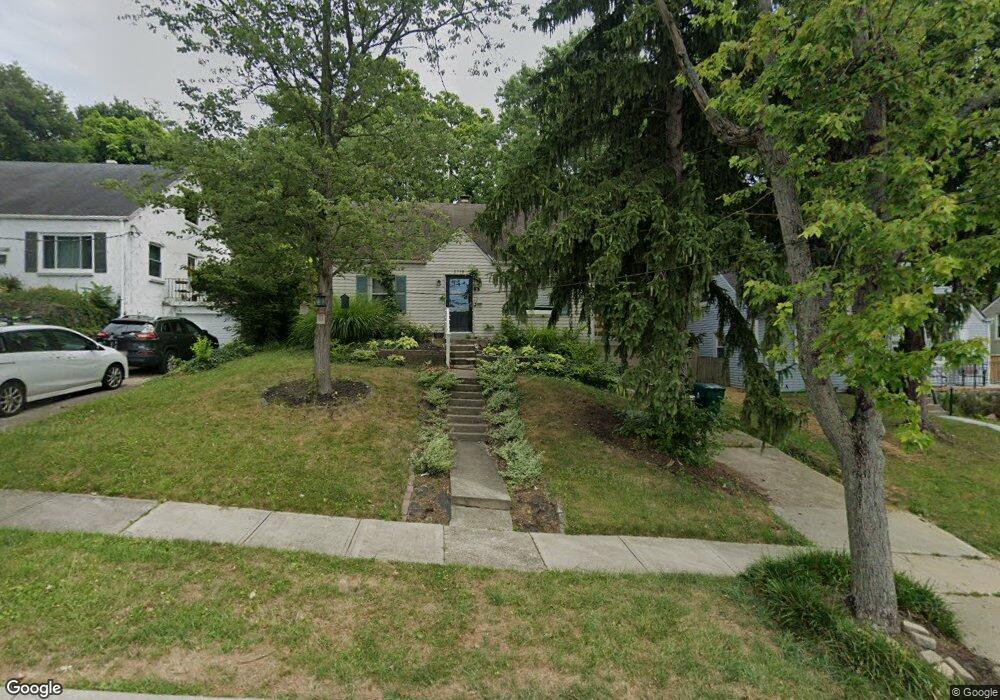
2718 Redfield Place Cincinnati, OH 45230
Turpin Hills NeighborhoodEstimated Value: $231,110 - $284,000
3
Beds
2
Baths
896
Sq Ft
$284/Sq Ft
Est. Value
About This Home
This home is located at 2718 Redfield Place, Cincinnati, OH 45230 and is currently estimated at $254,528, approximately $284 per square foot. 2718 Redfield Place is a home located in Hamilton County with nearby schools including Mt. Washington Elementary School, Clark Montessori High School, and Shroder High School.
Ownership History
Date
Name
Owned For
Owner Type
Purchase Details
Closed on
Sep 5, 2012
Sold by
Sheppard Edwin and Sheppard Patricia
Bought by
Lutz Austin
Current Estimated Value
Home Financials for this Owner
Home Financials are based on the most recent Mortgage that was taken out on this home.
Original Mortgage
$75,400
Outstanding Balance
$52,149
Interest Rate
3.56%
Mortgage Type
Seller Take Back
Estimated Equity
$202,379
Purchase Details
Closed on
Aug 12, 2009
Sold by
Montgomery Paul and Montgomery Emily F
Bought by
Montgomery Paul and Montgomery Emily F
Home Financials for this Owner
Home Financials are based on the most recent Mortgage that was taken out on this home.
Original Mortgage
$107,900
Interest Rate
5.36%
Mortgage Type
New Conventional
Purchase Details
Closed on
Oct 31, 2001
Sold by
Lee Lawson Karen
Bought by
Montgomery Paul
Home Financials for this Owner
Home Financials are based on the most recent Mortgage that was taken out on this home.
Original Mortgage
$90,100
Interest Rate
9.37%
Create a Home Valuation Report for This Property
The Home Valuation Report is an in-depth analysis detailing your home's value as well as a comparison with similar homes in the area
Home Values in the Area
Average Home Value in this Area
Purchase History
| Date | Buyer | Sale Price | Title Company |
|---|---|---|---|
| Lutz Austin | -- | None Available | |
| Montgomery Paul | -- | Attorney | |
| Montgomery Paul | $106,000 | -- |
Source: Public Records
Mortgage History
| Date | Status | Borrower | Loan Amount |
|---|---|---|---|
| Open | Lutz Austin | $75,400 | |
| Previous Owner | Montgomery Paul | $107,900 | |
| Previous Owner | Montgomery Paul | $90,100 |
Source: Public Records
Tax History Compared to Growth
Tax History
| Year | Tax Paid | Tax Assessment Tax Assessment Total Assessment is a certain percentage of the fair market value that is determined by local assessors to be the total taxable value of land and additions on the property. | Land | Improvement |
|---|---|---|---|---|
| 2024 | $3,142 | $51,045 | $8,796 | $42,249 |
| 2023 | $3,211 | $51,045 | $8,796 | $42,249 |
| 2022 | $2,988 | $42,518 | $7,161 | $35,357 |
| 2021 | $2,877 | $42,518 | $7,161 | $35,357 |
| 2020 | $2,958 | $42,518 | $7,161 | $35,357 |
| 2019 | $2,840 | $37,297 | $6,283 | $31,014 |
| 2018 | $2,844 | $37,297 | $6,283 | $31,014 |
| 2017 | $2,706 | $37,297 | $6,283 | $31,014 |
| 2016 | $1,884 | $26,391 | $6,283 | $20,108 |
| 2015 | $1,700 | $26,391 | $6,283 | $20,108 |
| 2014 | $1,712 | $26,391 | $6,283 | $20,108 |
| 2013 | $2,198 | $33,359 | $6,283 | $27,076 |
Source: Public Records
Map
Nearby Homes
- 5463 Hanover Cir
- 2663 Mendova Ln
- 2536 Ranchvale Dr
- 2560 Coveyrun Ct
- 2904 Turpin Lake Place
- 2454 Doeview Ct
- 2456 Doeview Ct
- 2447 Coveyrun S
- 2460 Cardinal Hill Ct
- 6557 Copperleaf Ln
- 6426 Silverfox Dr
- 6436 Wildhaven Way
- 6071 Tridale Ct
- 2220 Salvador St
- 1267 Cristway Ct
- 6113 Wayside Ct
- 6050 Bagdad Dr
- 6196 Turpin Hills Dr
- 2455 Rainbow Ct
- 1944 Rockland Ave
- 2724 Redfield Place
- 5451 Hanover Cir
- 2706 Redfield Place
- 2730 Redfield Place
- 5457 Hanover Cir
- 5455 Hanover Cir
- 2736 Redfield Place
- 5459 Hanover Cir
- 2719 Redfield Place
- 2700 Redfield Place
- 2725 Redfield Place
- 2713 Redfield Place
- 5490 Beechmont Ave
- 5461 Hanover Cir
- 2731 Redfield Place
- 2707 Redfield Place
- 2742 Redfield Place
- 5465 Hanover Cir
- 2737 Redfield Place
- 2701 Redfield Place